Turnaround Tuesdays on Steroids
A simple strategy that achieved 29% annual returns since 1999, with only two negative years

The idea
“Simplicity is the ultimate sophistication.” Leonardo da Vinci
The Turnaround Tuesdays trading strategy is a simple strategy based on the observation that stocks tend to rebound on Tuesdays after a down Monday.
Several blogs report this strategy. Curiously, I found some reporting a good performance, while others reported low returns, and others even reported a negative performance. Why would that be?
The simplicity of this strategy sparked my curiosity, and I decided to test it.
The entry rules couldn't be more simple:
Today is Tuesday;
Yesterday's close (Monday) was lower than Friday's;
Friday's close was lower than Thursday's;
Go long at the opening.
The exit is also simple:
Exit the trade when the close is higher than yesterday's high.
First experiments
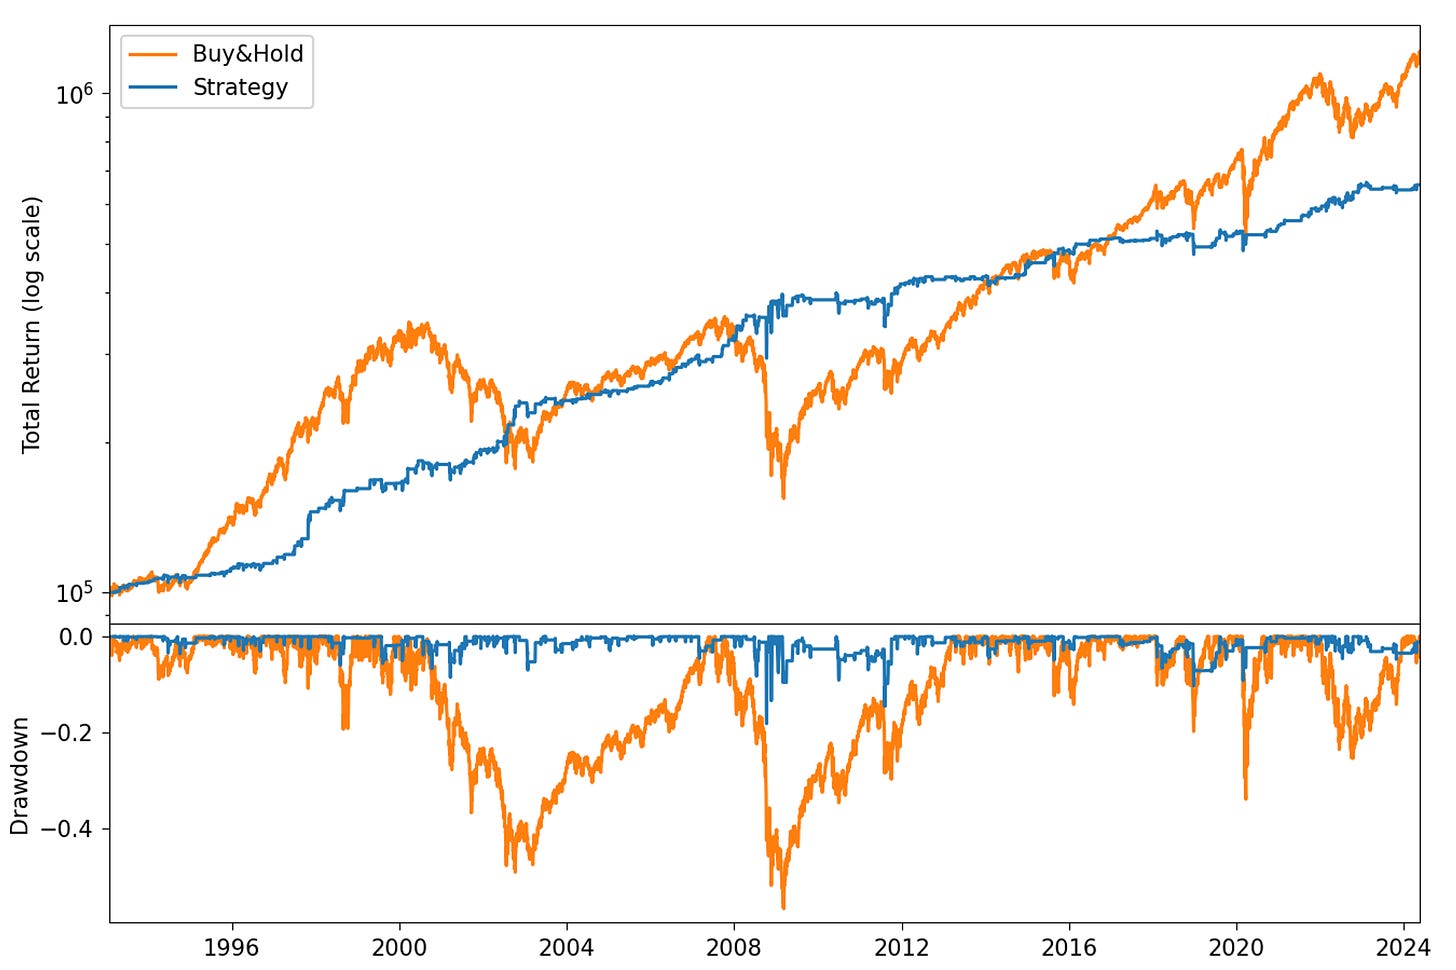
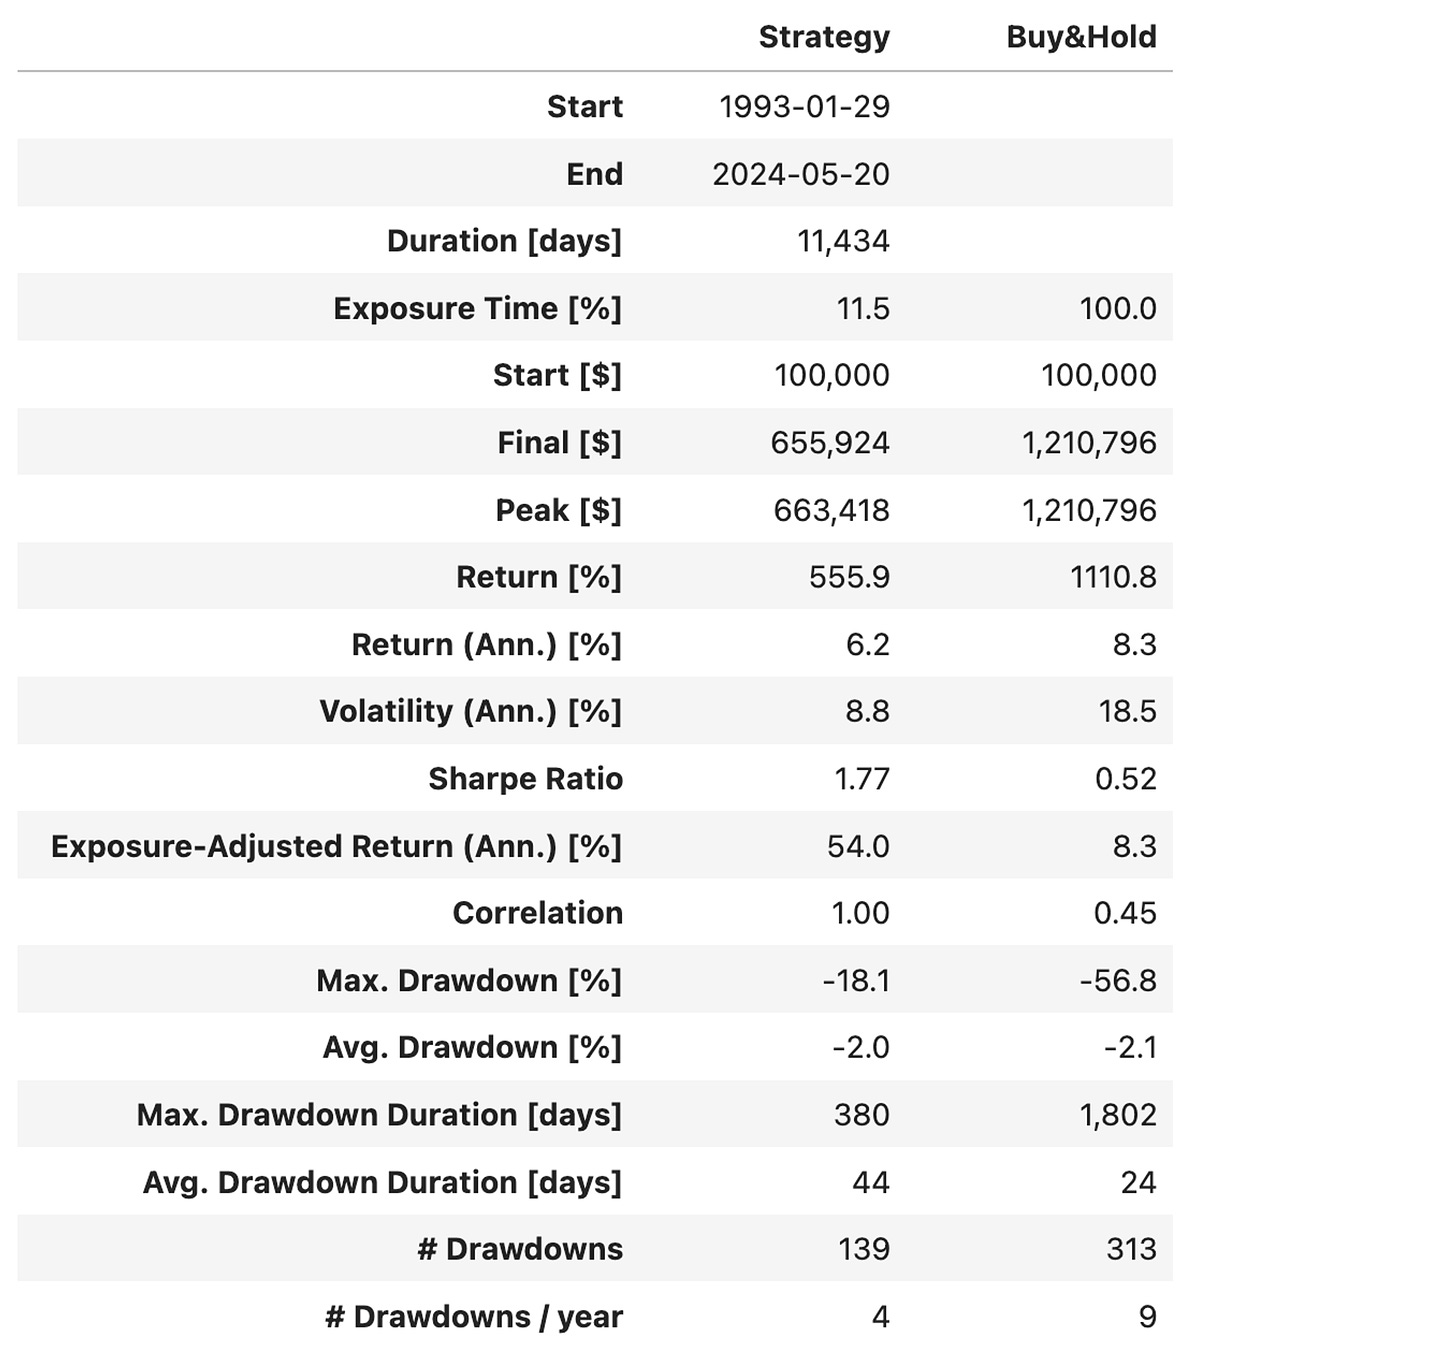
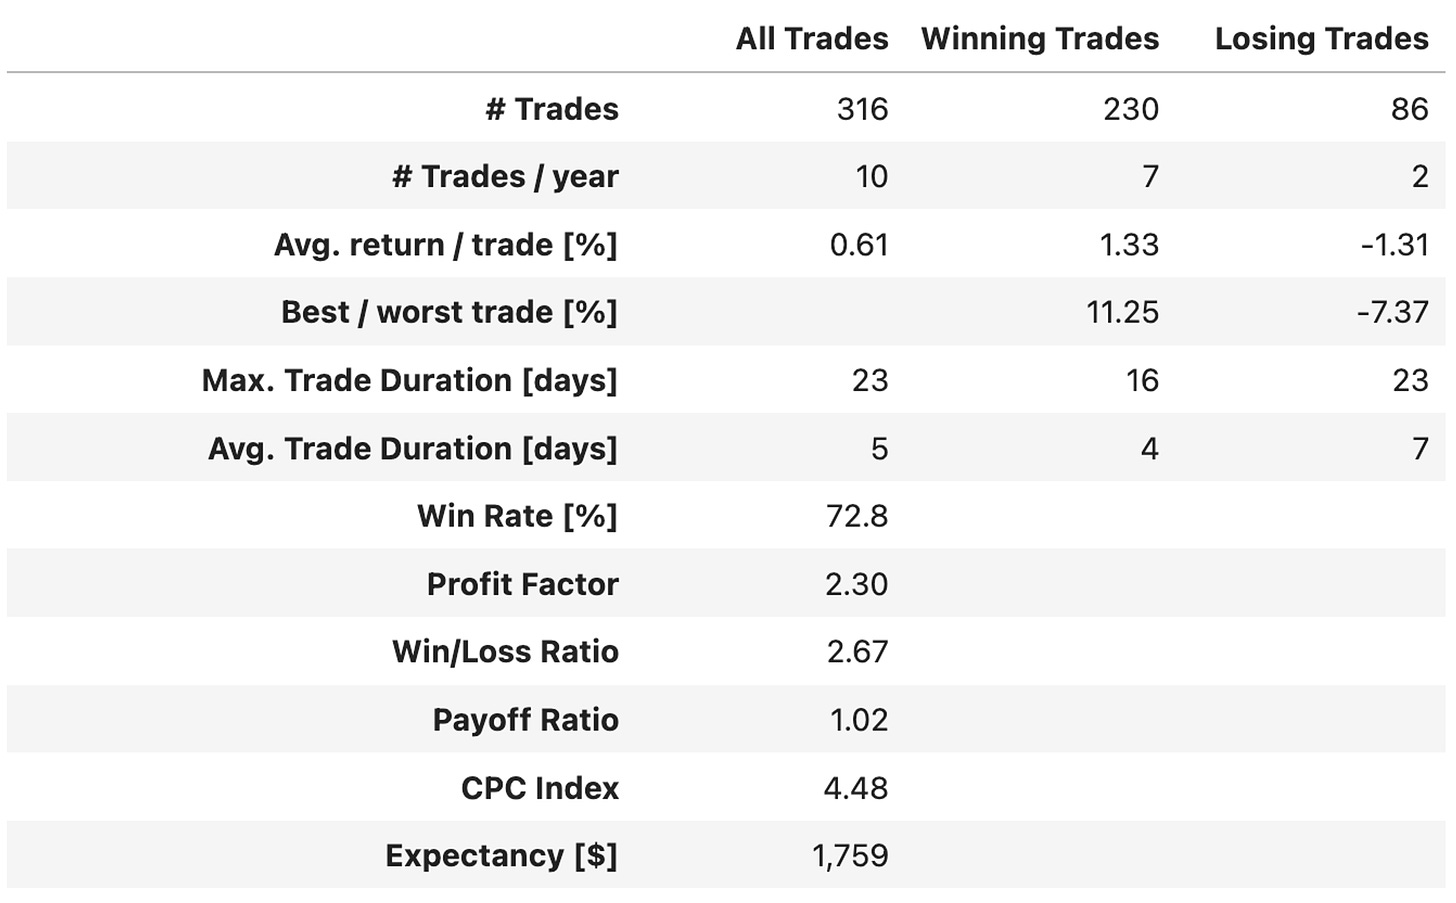
Running the strategy exactly as described over the internet with SPY as the instrument to trade, I got a 1.77 Sharpe, 6.2% annual return (vs. 8.2% Buy&Hold), and a maximum drawdown of 18% (vs. 57% Buy&Hold) in over 31 years of backtest. Not bad for such a simple set of rules that stay exposed only 11% of the time.
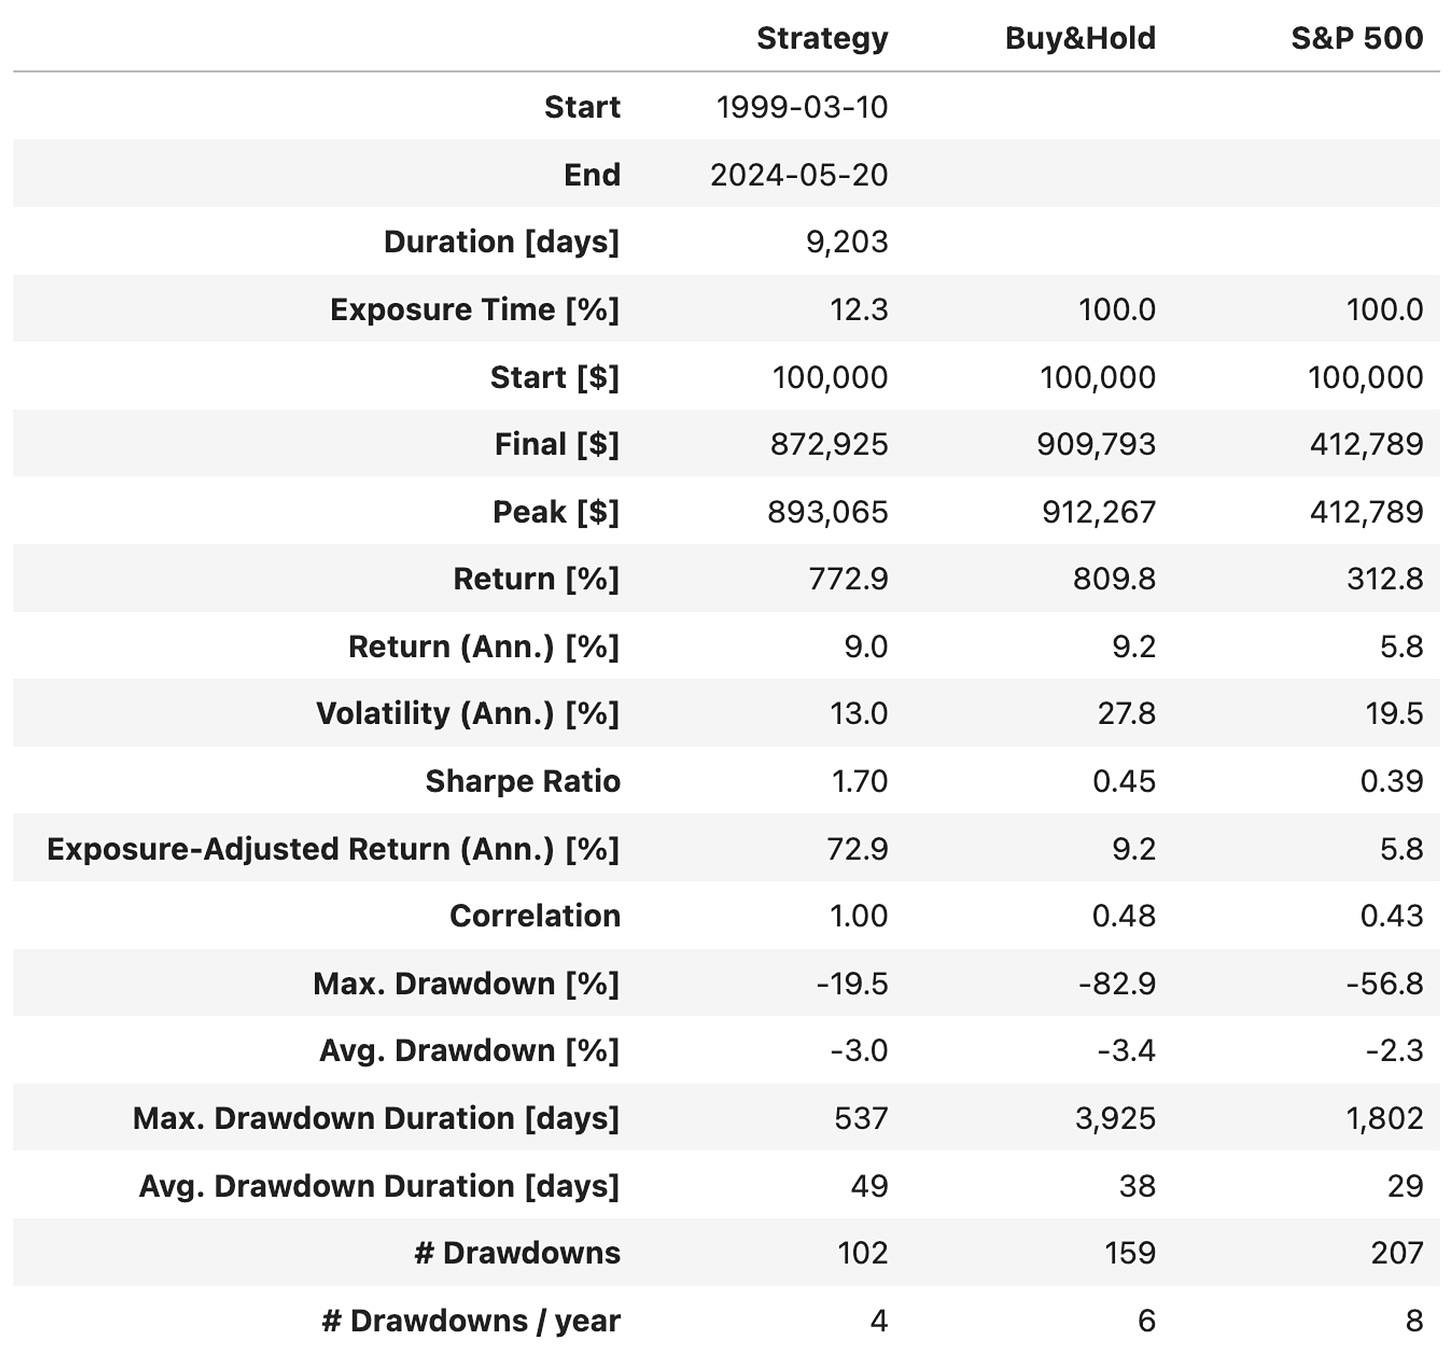
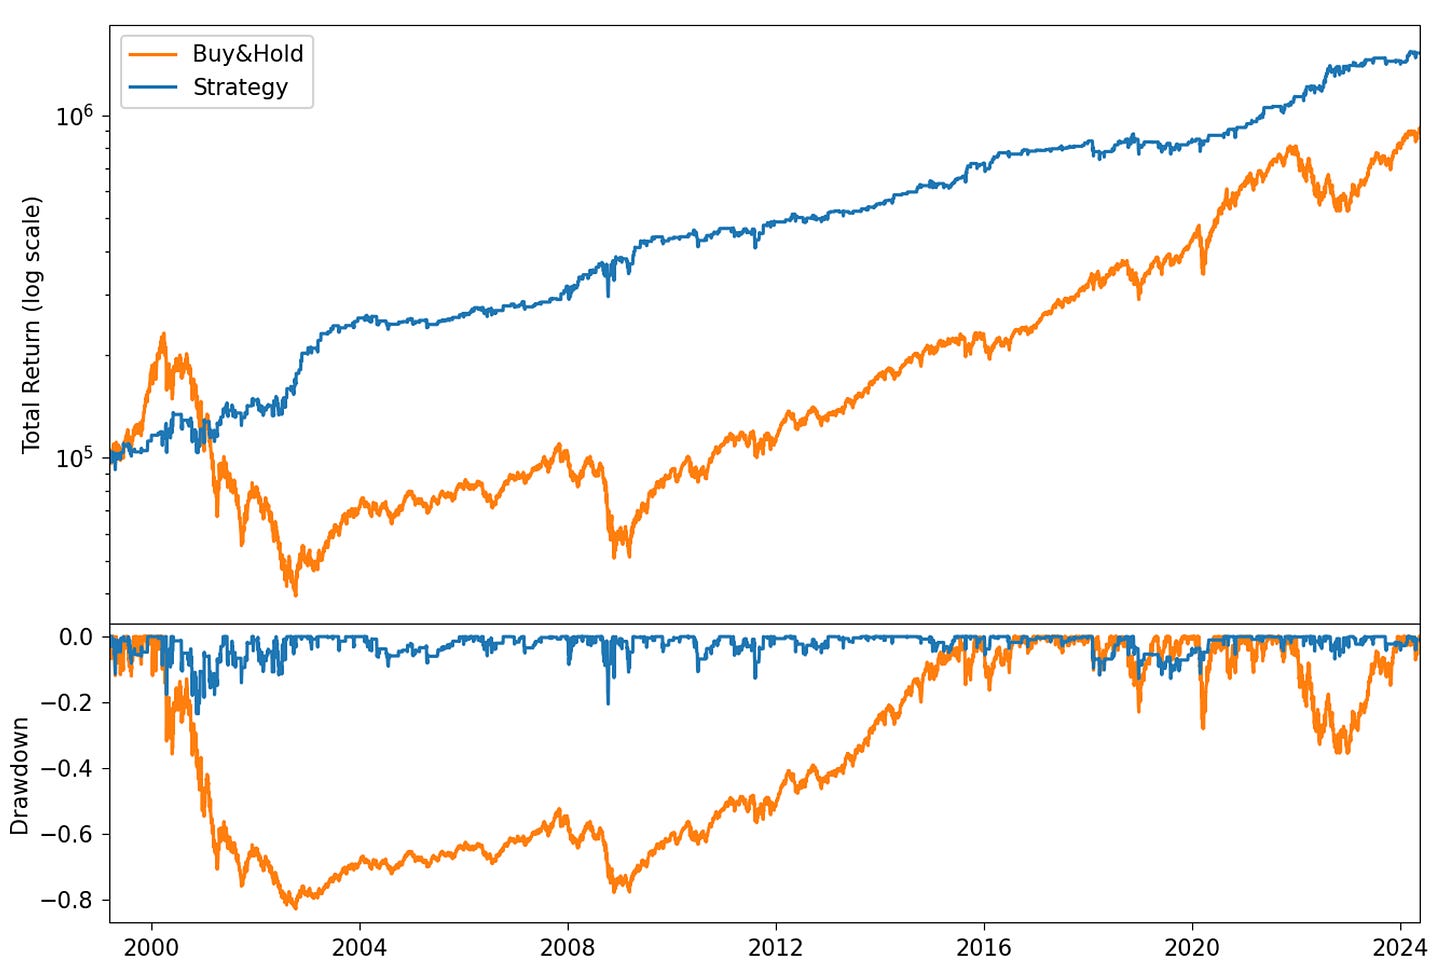
Running it with QQQ resulted in a better outlook:
I found these results pretty impressive:
A 1.70 Sharpe with a 9.0% annual return (vs. 9.2% Buy&Hold) despite being invested only 12.3% of the time;
A maximum drawdown of 19.5%, significantly less than the Buy&Hold, and on average only 4 drawdowns/year (vs. 6 the benchmark);
After seeing these results, my first thought was: can we improve them?
Do we need Tuesdays?
I tried several variations of this strategy: different days of the week, different numbers of consecutive lows to enter the trade, etc. None of them quite worked.
Until I had the idea: what if we dropped the Tuesday rule? What if we considered other days together with Tuesday?
After trying all possible combinations, I found that Tuesday and Wednesday worked best.
The modified entry rules:
Today is Tuesday or Wednesday;
Yesterday's close was lower than the close of 2 days ago;
The close of 2 days ago was lower than the close of 3 days ago;
Go long at the opening.
No changes in the exit rules.
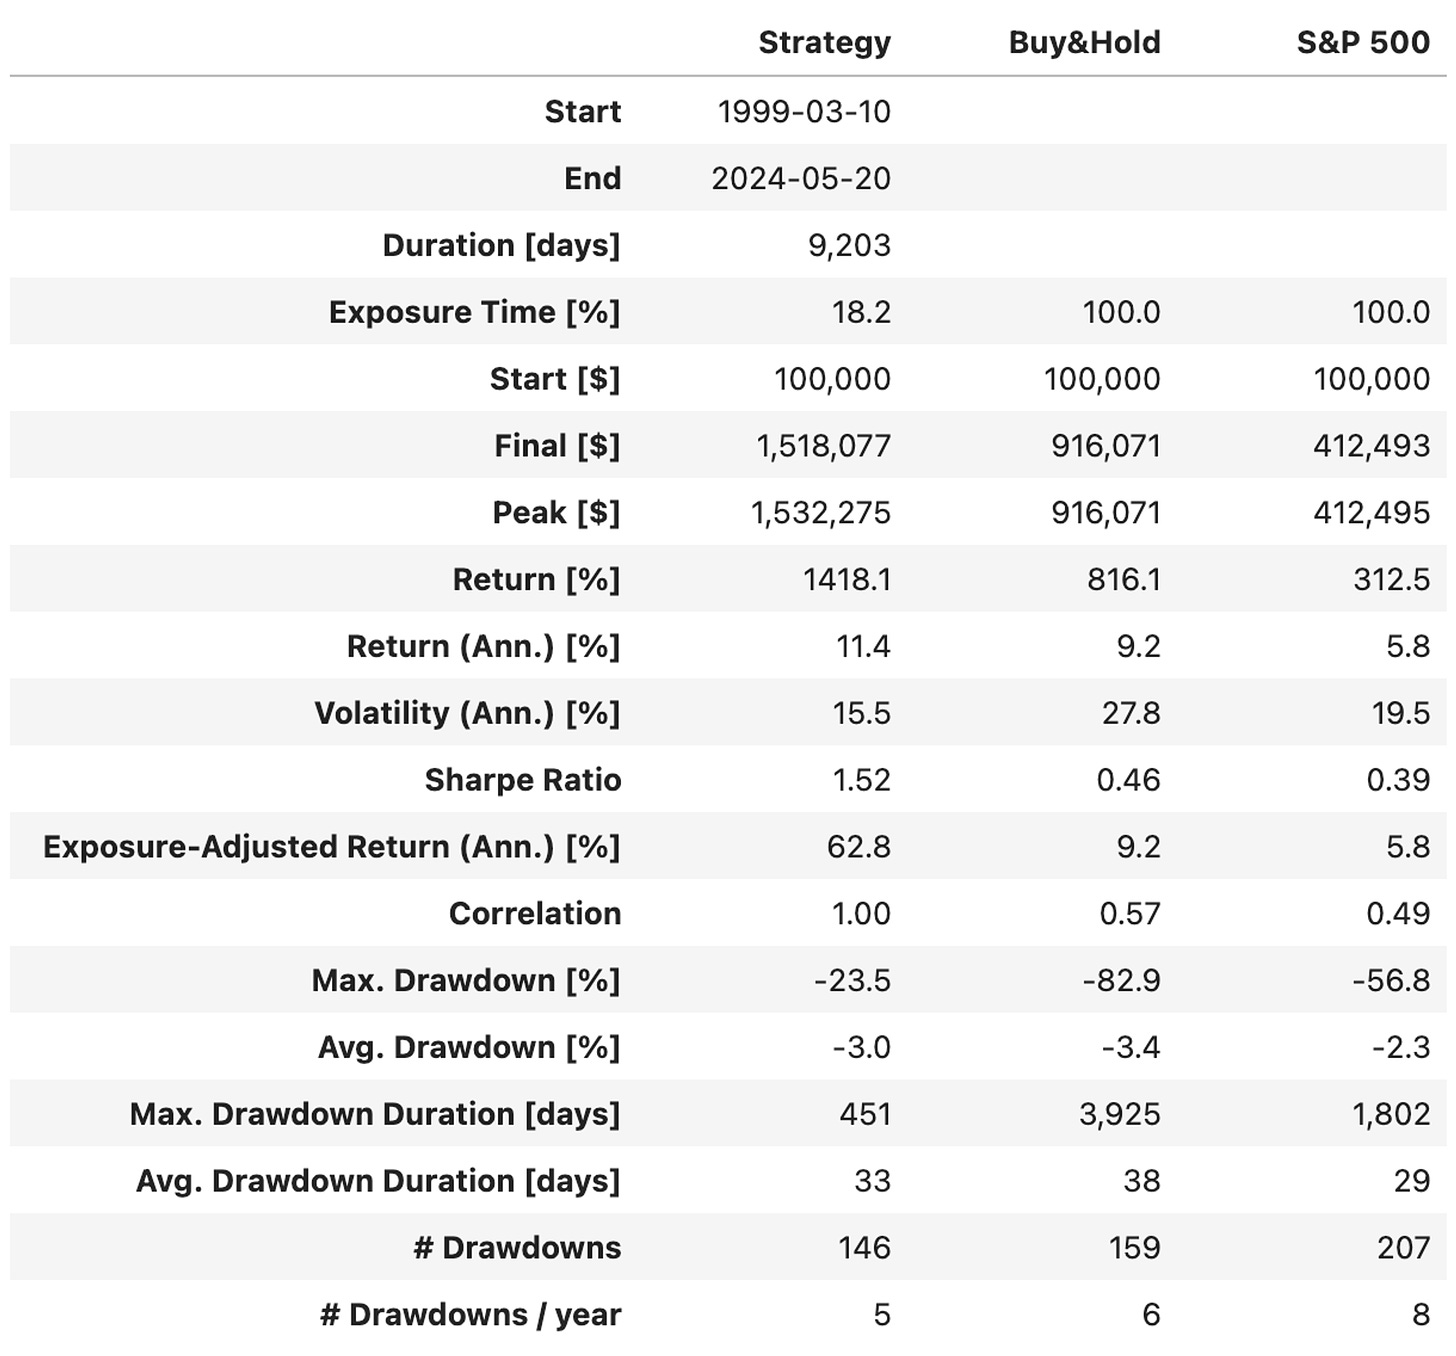
Here are the results:
As expected, the exposure time increased (from 12% to 18%). As a result:
The annualized return went from 9.0% to 11.4%, 2ppts above the 9.2% Buy&Hold;
Sharpe went down to 1.52, with a little increase in maximum drawdown (23.5%). The higher number of drawdowns (5/year vs. 4/year previous number) was offset by shorter drawdowns (33 days vs. 49 previous number);
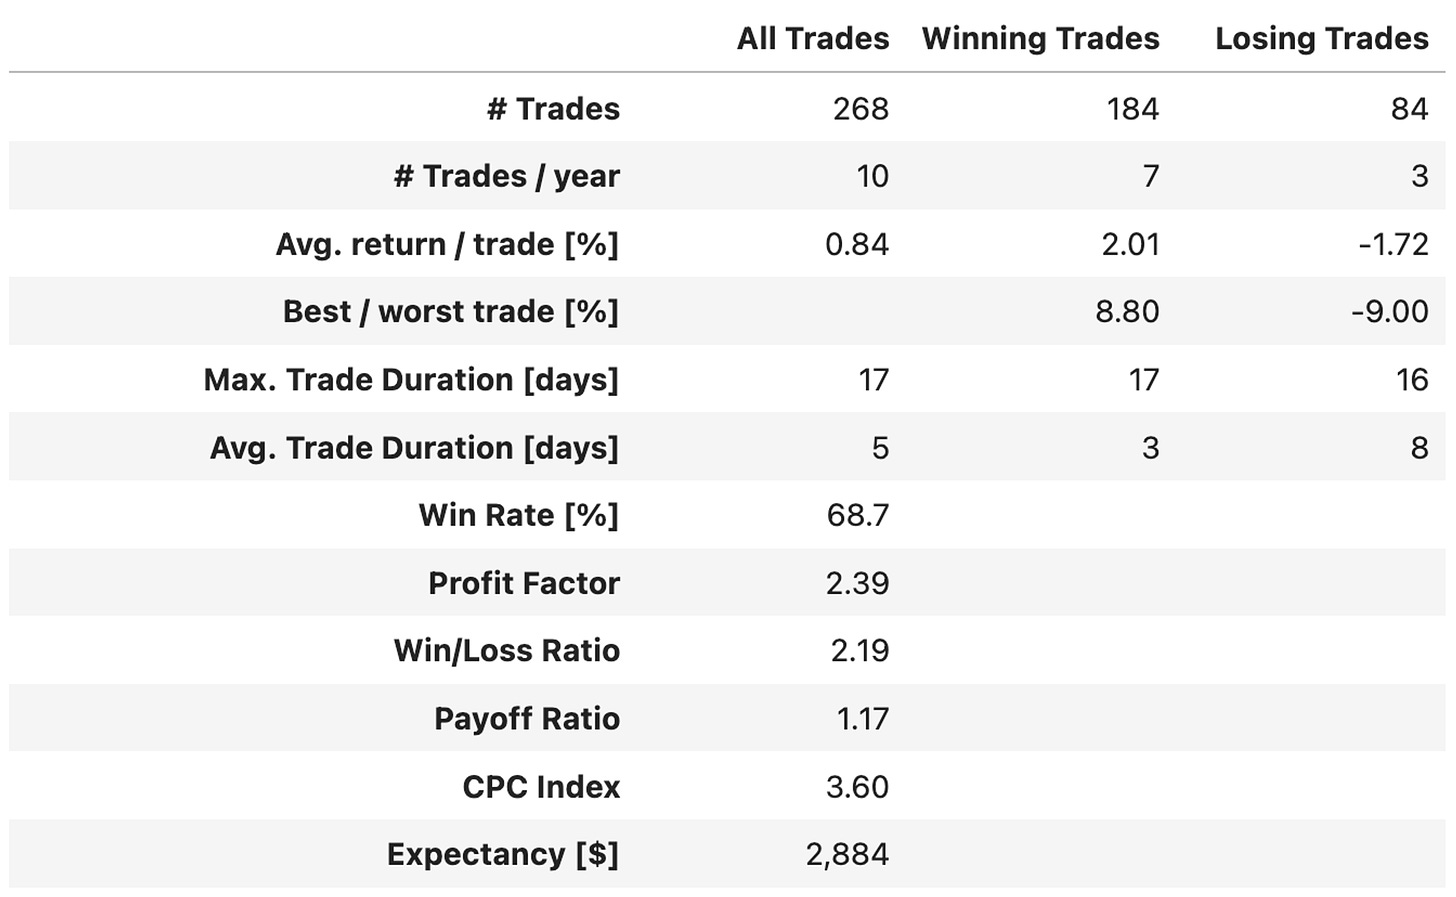
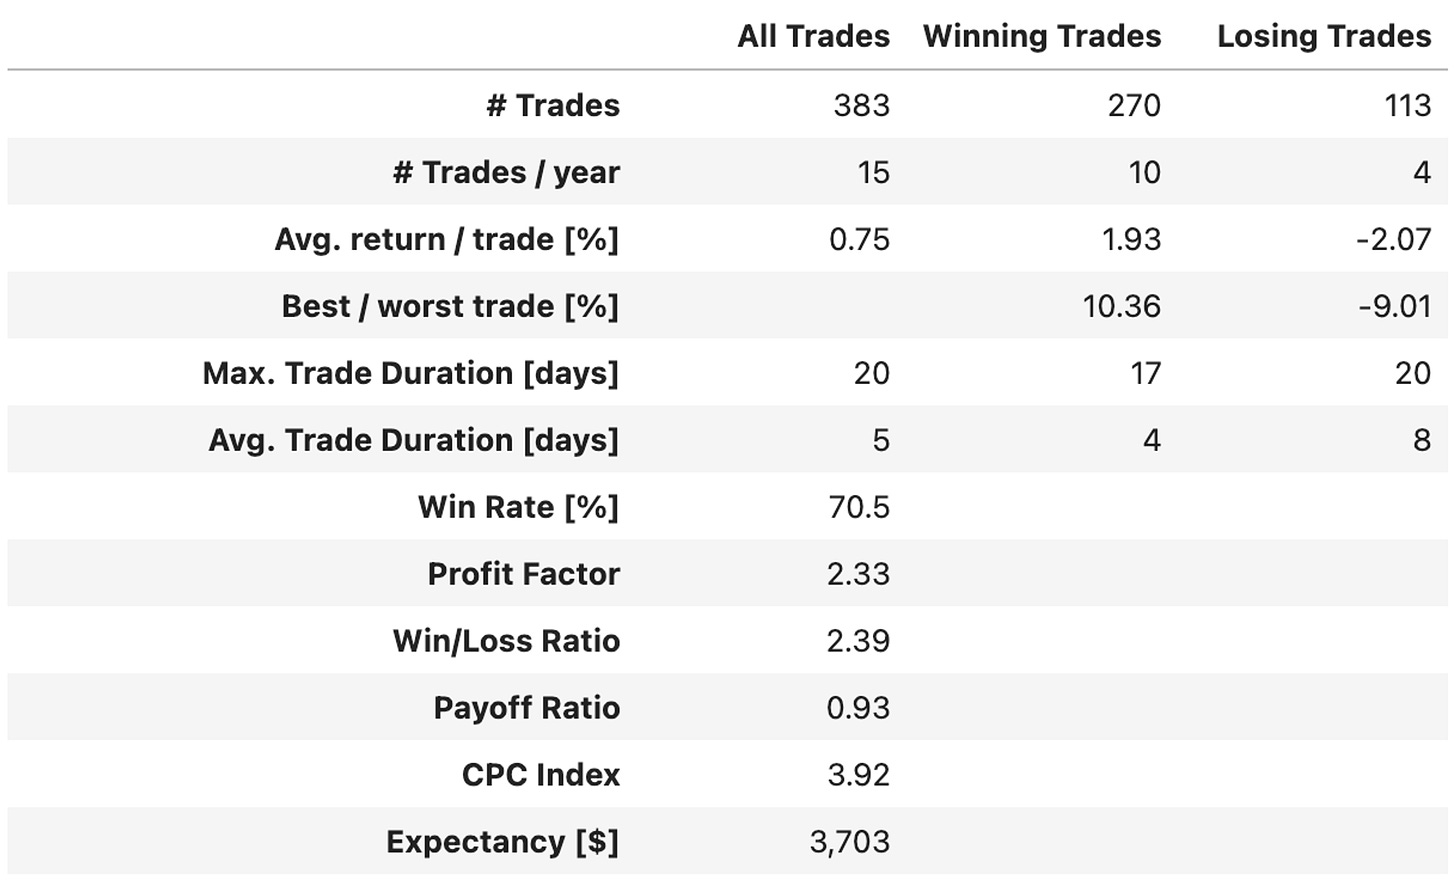
We went from 10 trades/year to 15 trades/year, while the win rate increased to over 70%!
I liked this improvement. But could we do better?
Using leverage
Instead of trading QQQ, what if we traded TQQQ? This ETF is leveraged: it aims to provide a 3:1 performance ratio to the Nasdaq-100 Index on a daily basis.
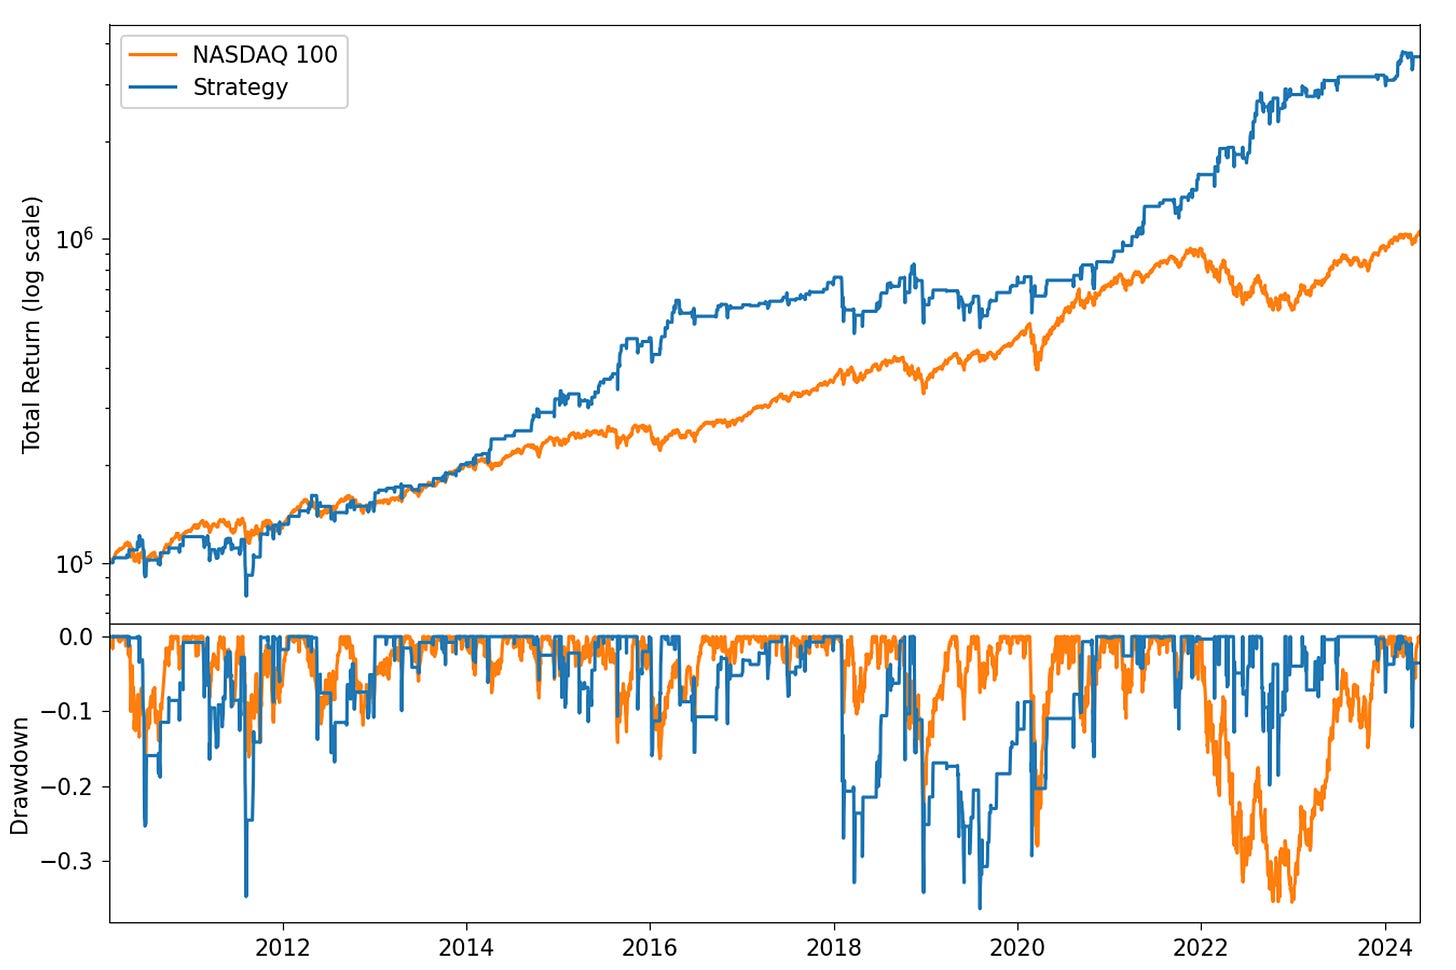
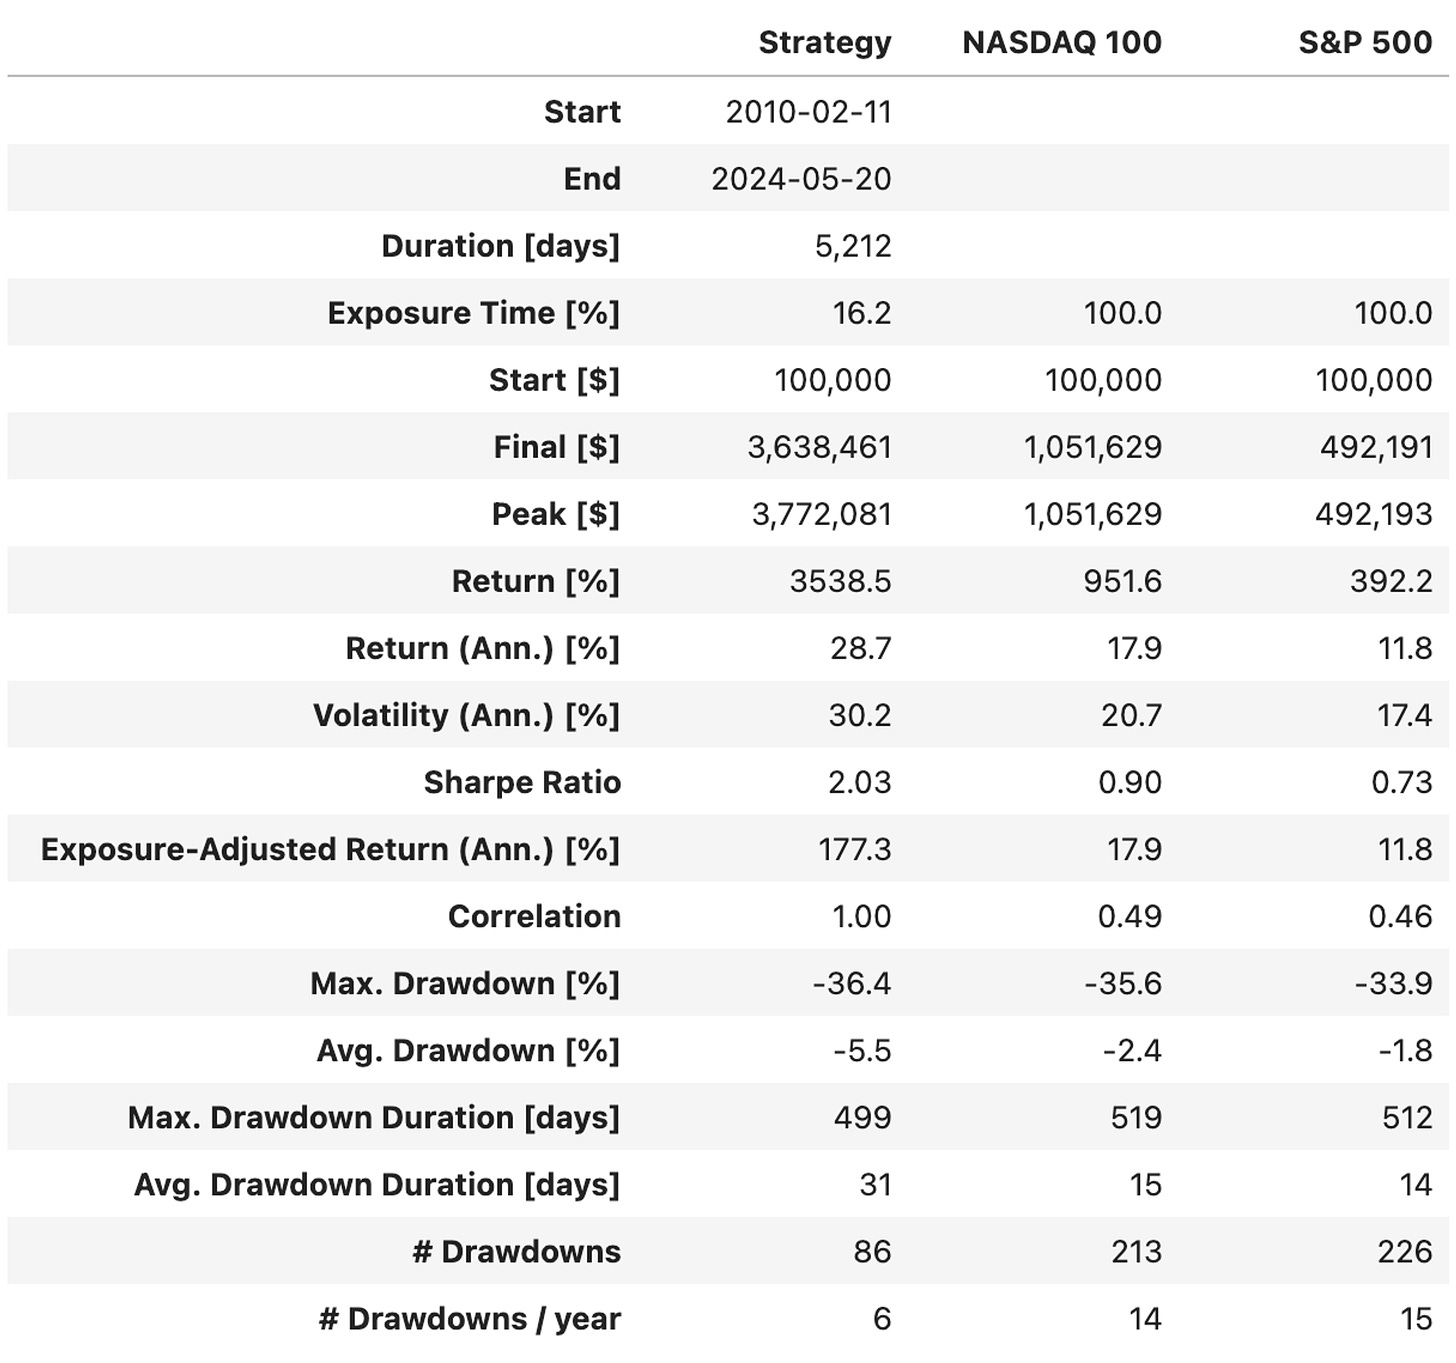
So, I kept the same rules and applied them to TQQQ. And voilà:
I must confess: I was impressed by these results! A 2.03 Sharpe with 28.7% annualized returns in comparison to 17.9% QQQ in the same period, despite being exposed only 16% of the time, is really notable.
However, the # of drawdowns increased to 6/year, the maximum drawdown reached 36.4%, with an average drawdown of 5.5%, almost 2x what we had earlier. There's no free lunch.
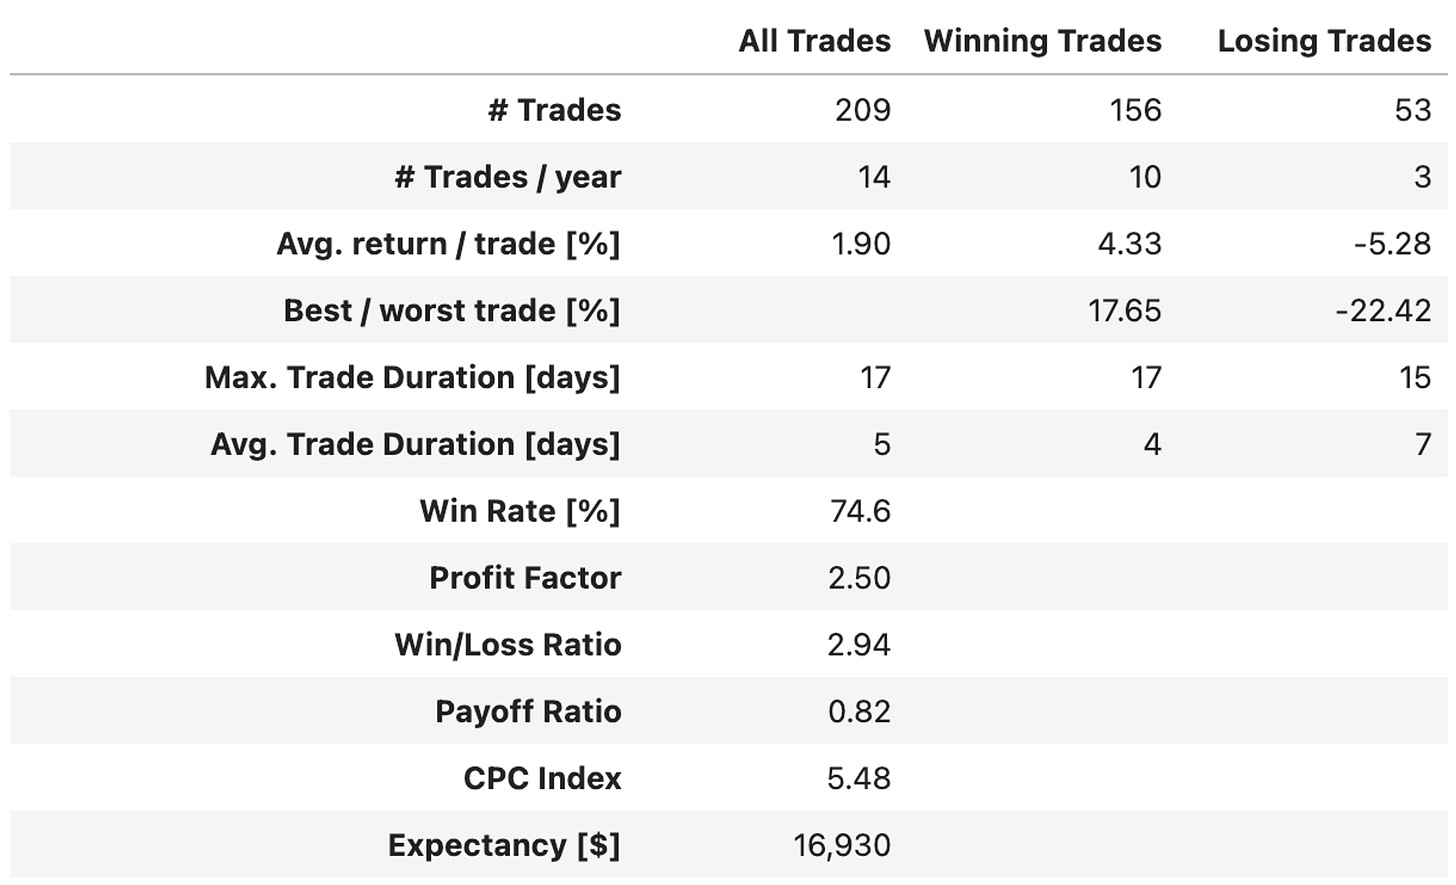
Analyzing the trades, the first number that caught my eye was 74.6% win rate. But then I realized there were only 209 trades in the backtest (14/year). That's because TQQQ inception date was February 9, 2010.
What could we do to address this low # of trades?
Synthetic TQQQ from Mar-1999 to Feb-2011
Hopefully it's not hard to generate synthetic TQQQ prices for dates before 2011-02-09 (TQQQ inception) and after 1999-03-10 (QQQ inception). We know that the ETF tracks 3x the performance of the Nasdaq-100 Index on a daily basis. We can do that in few lines of code (you can check it here).
Re-running the backtest with TQQQ with:
Synthetic prices from 1999-03-10 to 2011-02-09
Real prices from 2011-02-09 to date
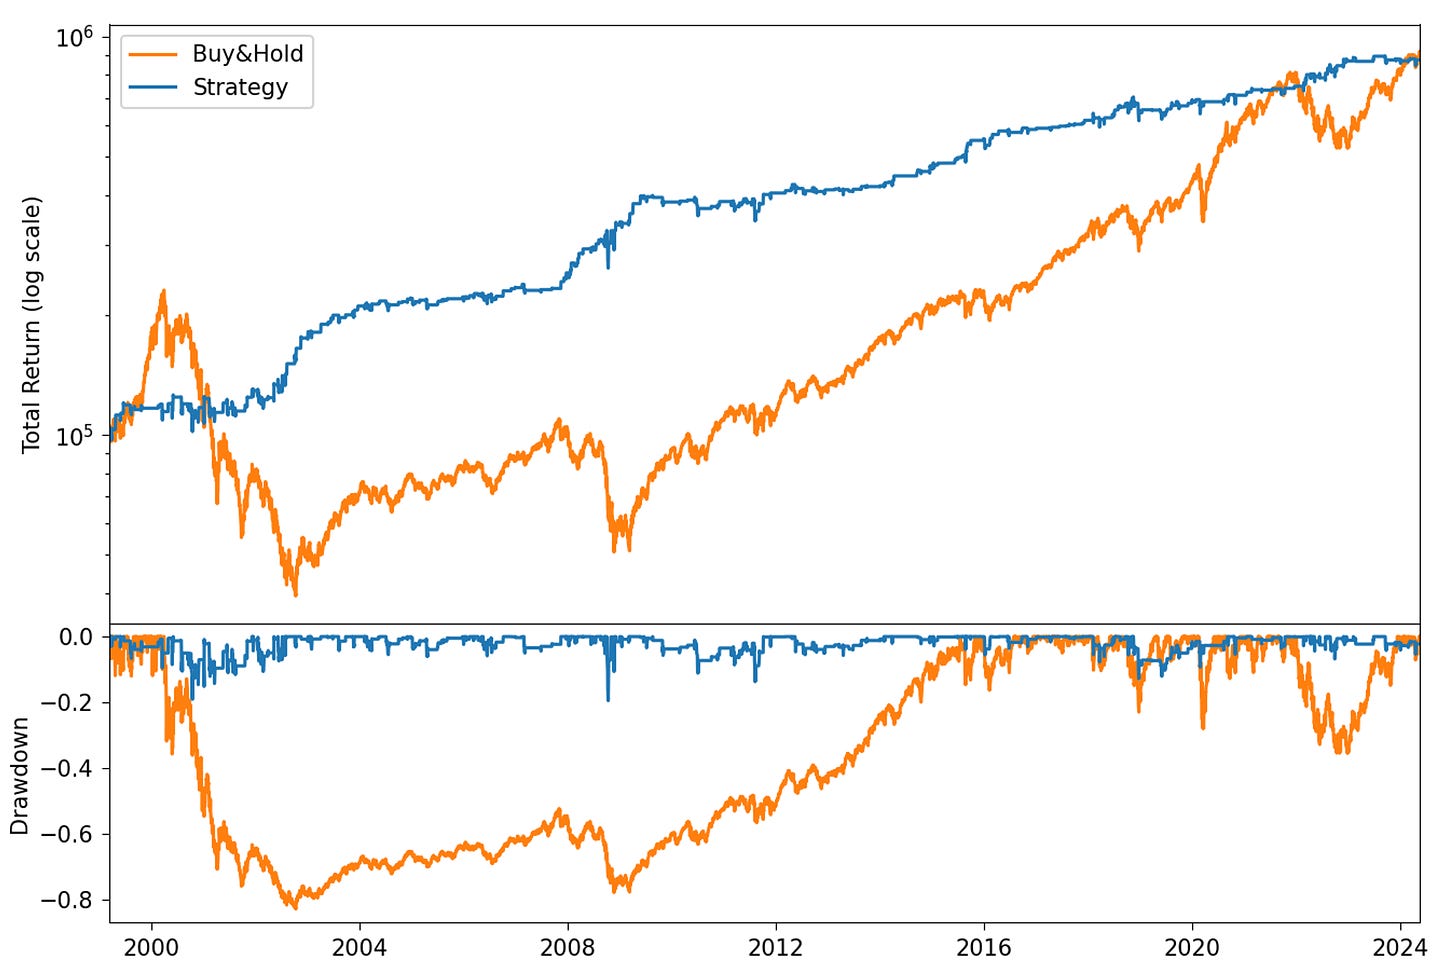
We arrive at the following results:
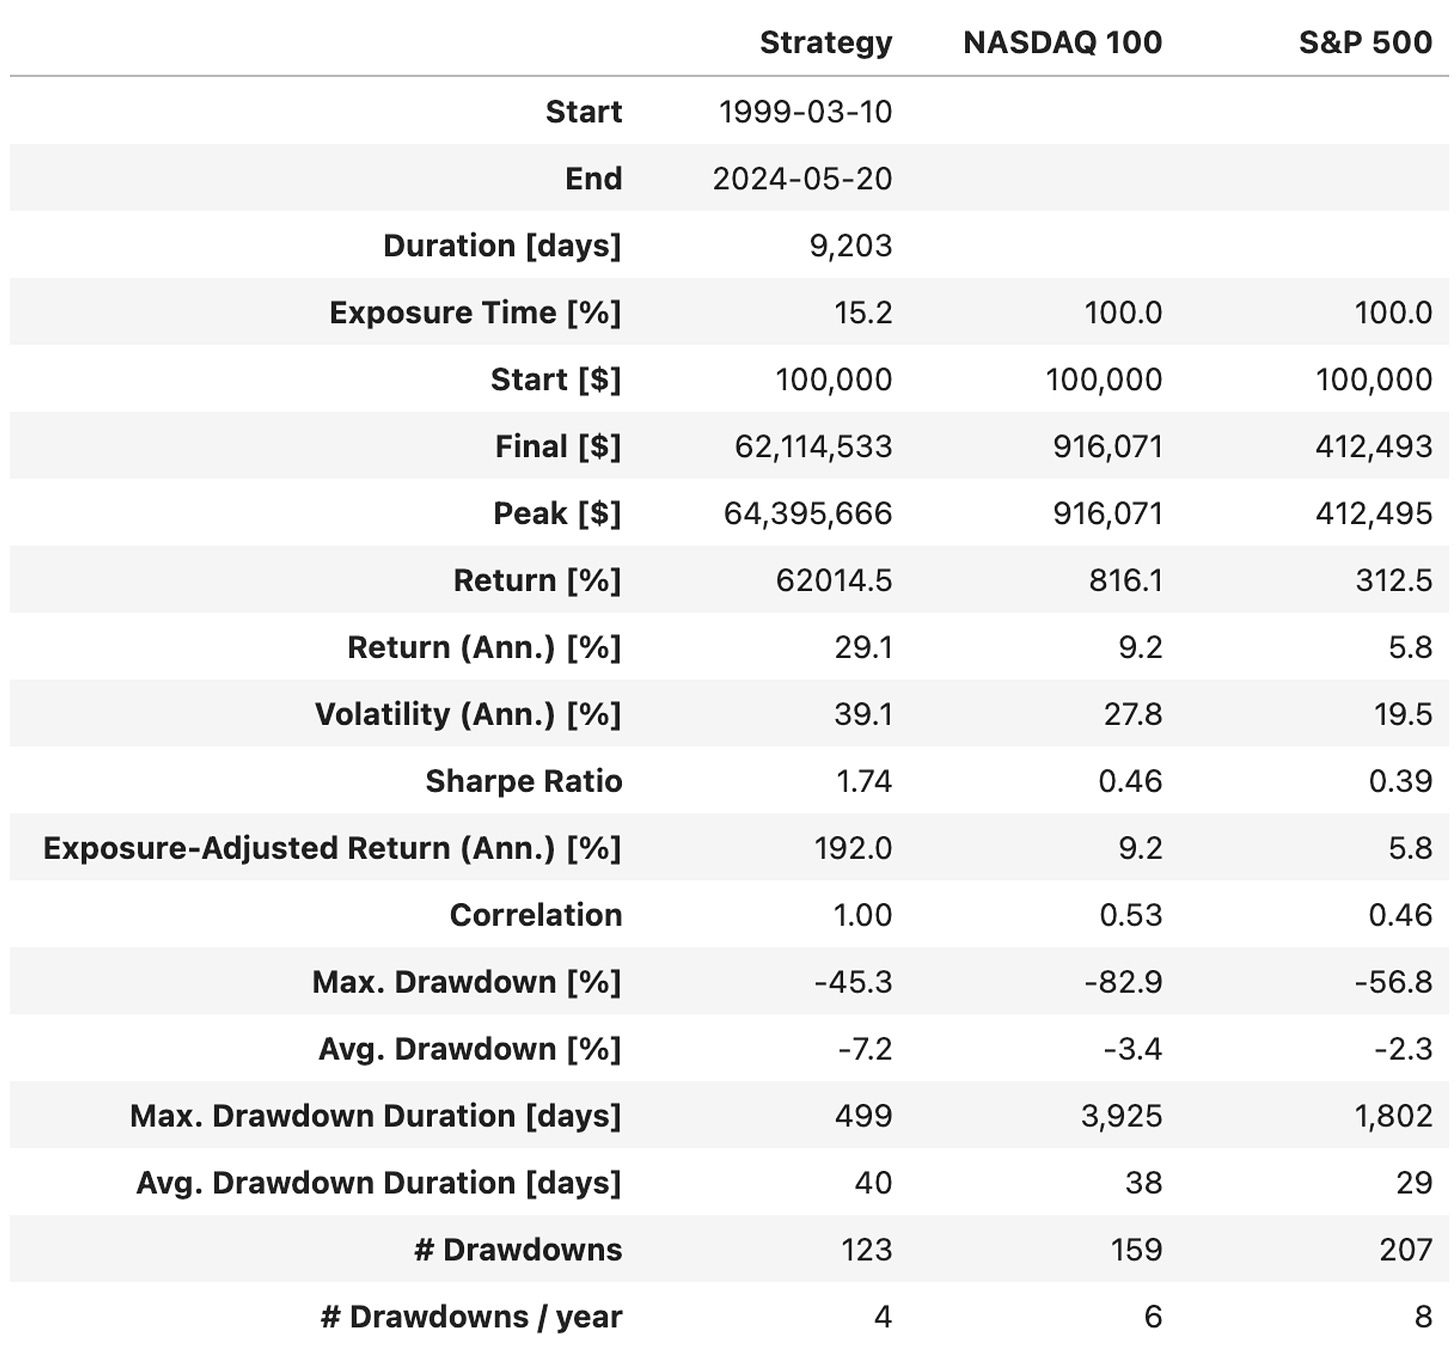
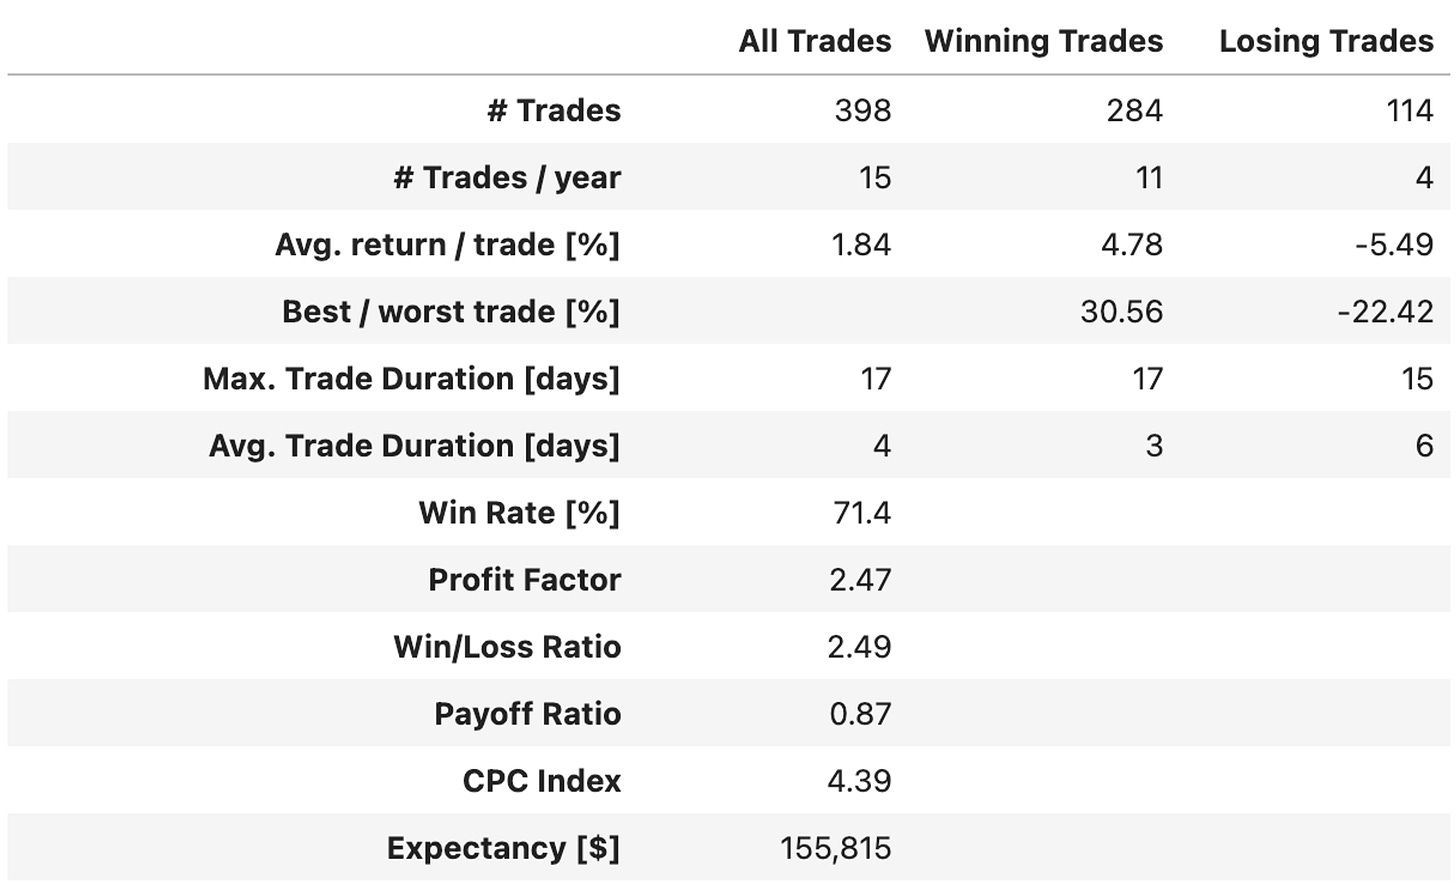
By backtesting for over 25 years now, we have managed to double the # of trades. As a result:
The backtest delivered a 1.74 Sharpe - lower than the 2.03 we achieved in the previous run - but this 1.74 should be a better estimate;
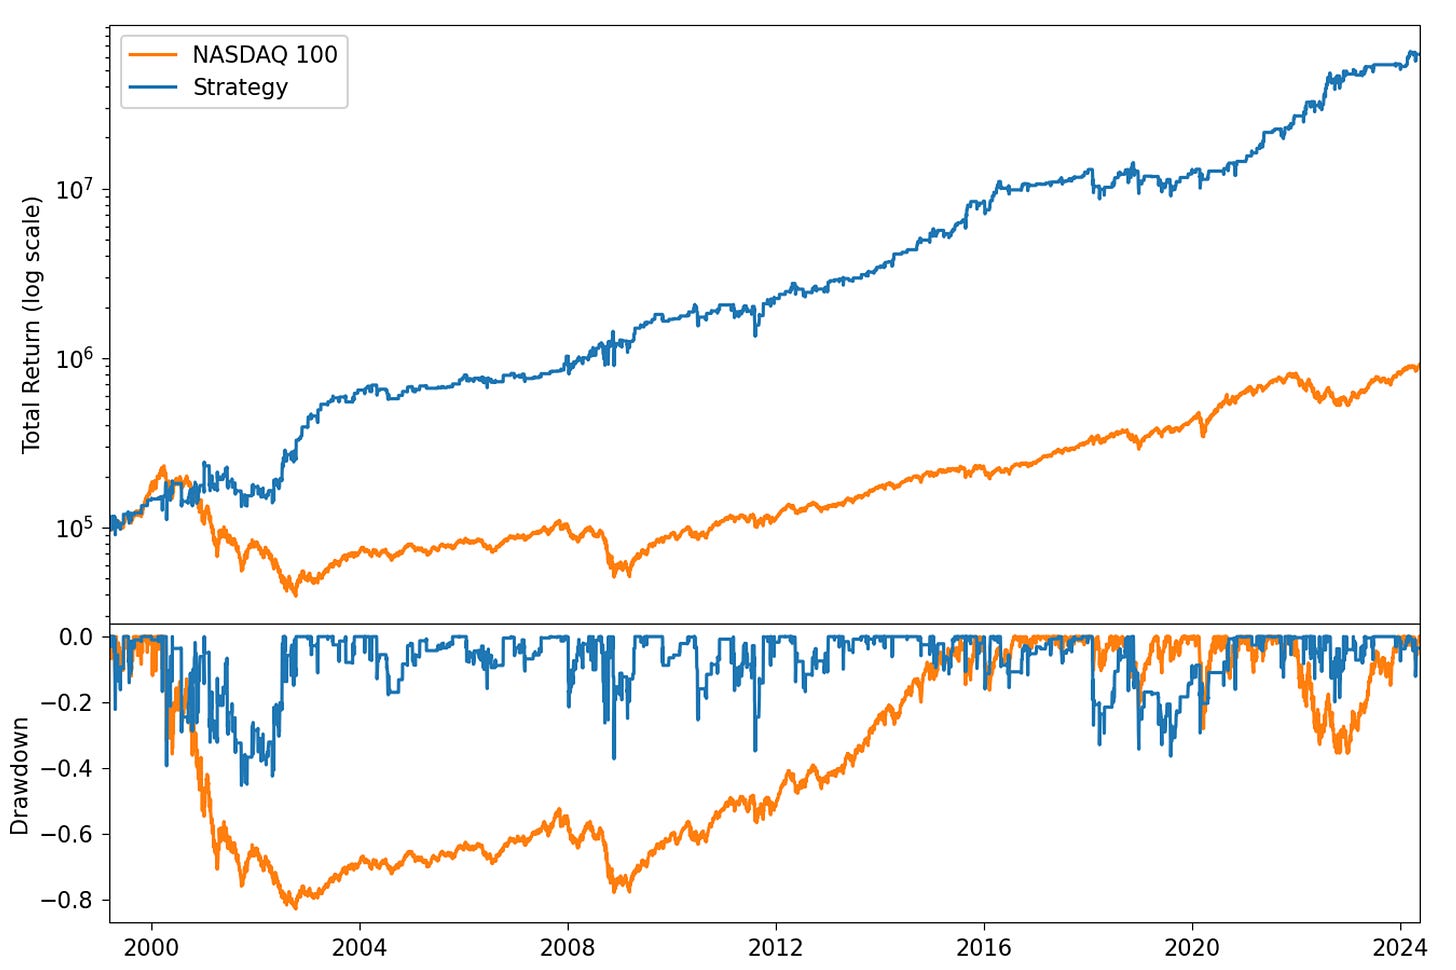
Impressively, the strategy achieved 29.1% annual returns vs. 9.2% QQQ! It was about the same as the previous number;
In this run, we saw a more severe maximum drawdown (45%), a worse average drawdown (7.2%), and a worse drawdown duration (40 days), but the # of drawdowns improved (to 4/year). Indeed, there's no free lunch;
With 15 trades/year, the strategy has a 71.4% win ratio. Although still high, this number is lower than the previous 75% and probably is a better estimate for this system.
Final Thoughts
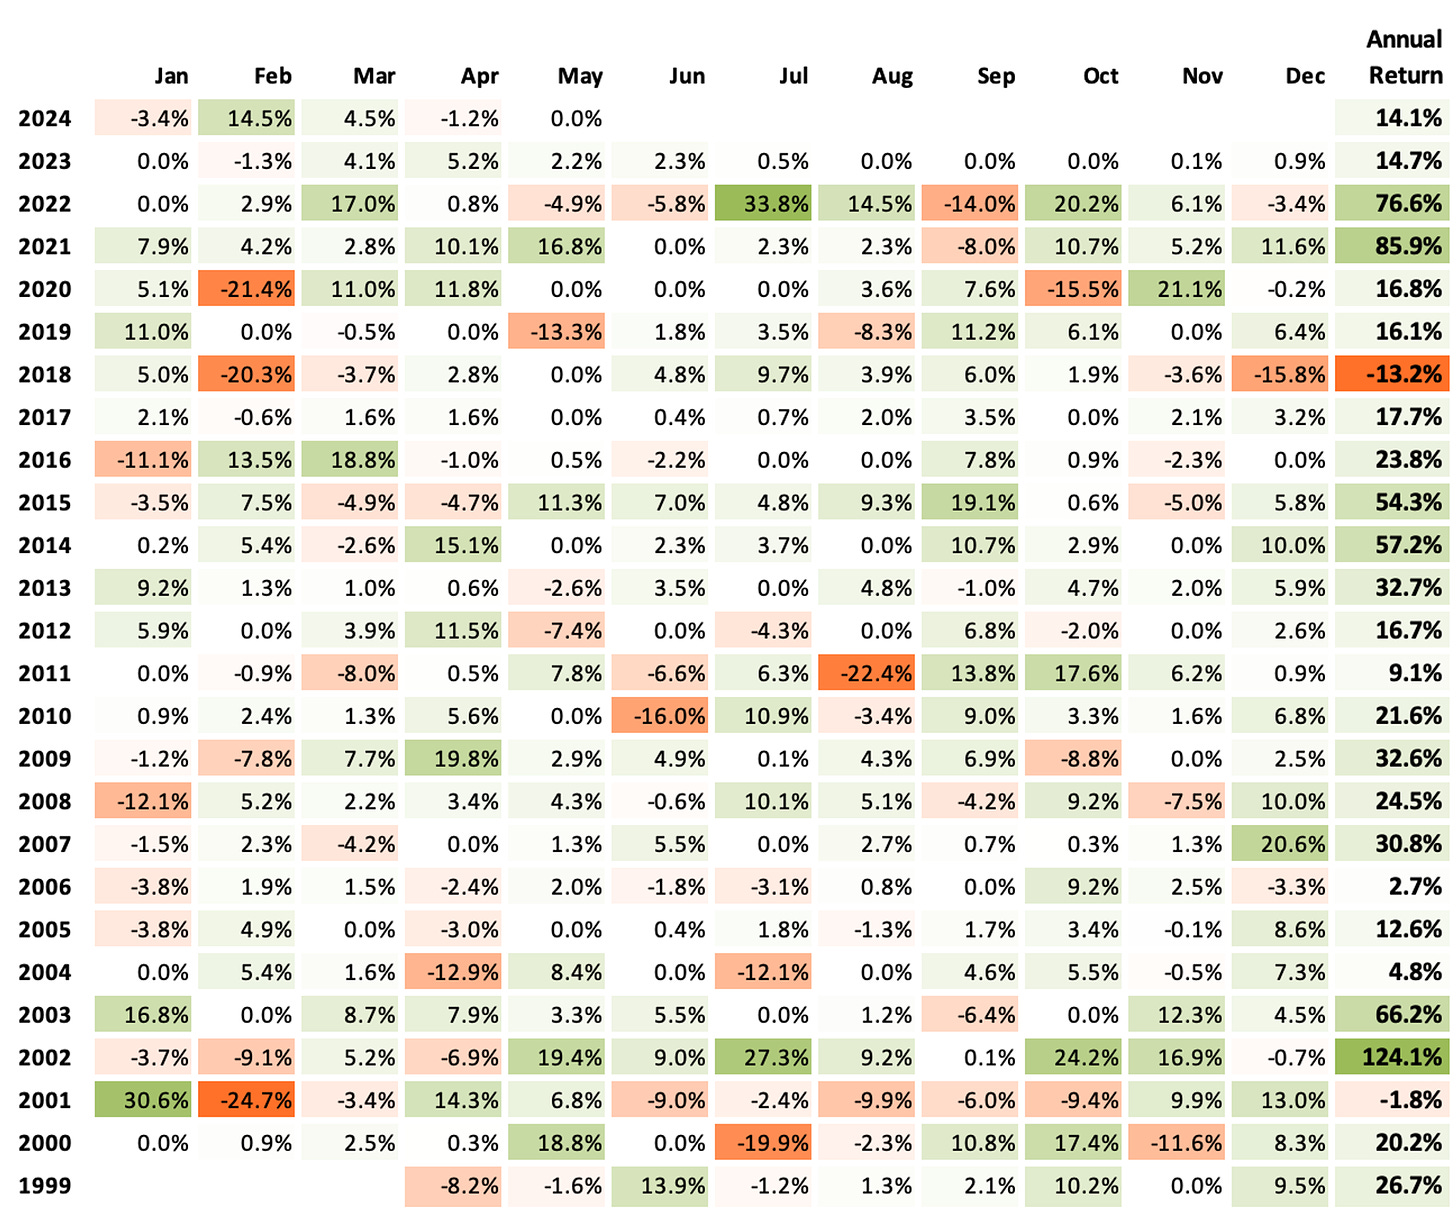
Should we trade this strategy? Looking at the monthly and annual returns, it's really tempting:
We would have had only 2 negative years since 1999. 78 negative months (in a total of 302 months: 26%). We would have had spectacular years when the NASDAQ 100 crashed:
2022: +76.6% vs. -32.97%
2008: +24.5% vs. -41.89%
2002: +124.1% vs. -37.58%
2000: +20.2% vs. -36.84%
Those numbers are compelling. Nevertheless, I believe the drawdowns are too frequent and too deep for my (and most people's) taste.
A good next step will be to test this strategy in a basket of stocks. This might significantly increase the number of trades and reduce the negative swings.
I'd love to hear your thoughts about this approach. If you have any questions or comments, just reach out via Twitter or email.
Also, if you want to implement this strategy and need help, just let me know.
Cheers!
Quantitativo


Hello,
What backtesting platform are you using to run your backtest on? Is it something custom built or are you using any framework?
Thank you
Isak
Thanks for sharing. Loved the simplicity so much I had to recreate it, and had fun whipping it up.
Here's my implementation for QQQ from Jan'99 - Jul'24, written using QuantConnect.
Some discrepancies, likely due to differences in data and entry timing. I was surprised to see such a difference in the sharpe calculation though... not sure what to make about that one.
1. Interactive Results (with code and performance statistics):
https://www.quantconnect.com/terminal/processCache/?request=embedded_backtest_ad0d3d439e42ea6dee2edde358c38ace.html
2. Report with additional stats against QQQ hold benchmark comparison:
https://www.quantconnect.com/reports/ad0d3d439e42ea6dee2edde358c38ace
3. Report with additional stats against SPY hold benchmark comparison:
https://www.quantconnect.com/reports/bda3d6baab0de972f303f9339e8fb18b