The Holy Grail still works
Changing a mean reversion strategy to deliver 30% annual returns since 1999
“But choose wisely, for while the true Grail will bring you life, the false Grail will take it from you.” Grail Knight, Indiana Jones and the Last Crusade, last scene.
The idea
In his 2008 book "Short Term Trading Strategies That Work," Larry Connors argues that the 2-period RSI might be the Holy Grail of indicators.
He says his studies have shown that statistically, there's no edge using the default 14-period RSI. However, his research shows that using a shorter timeframe leads to impressive results. "We have built many trading methods that incorporate the 2-period RSI."
Put simply, the higher the RSI reading, the more overbought the stock is, and the lower the reading, the more oversold the stock is. I'm not going to review the RSI or how it is computed; I strongly recommend the book if you want a refresher on the indicator.
Connors demonstrates his point by sharing a strategy with simple rules:
The S&P 500 Index is above its 200-day moving average;
The 2-period RSI of the S&P 500 Index closes below 5;
Buy the S&P on the close;
Exit when the S&P closes above its 5-period moving average.
This is a mean-reversion strategy, Larry Connors' specialty.
What's the edge of this mean-reversion signal?
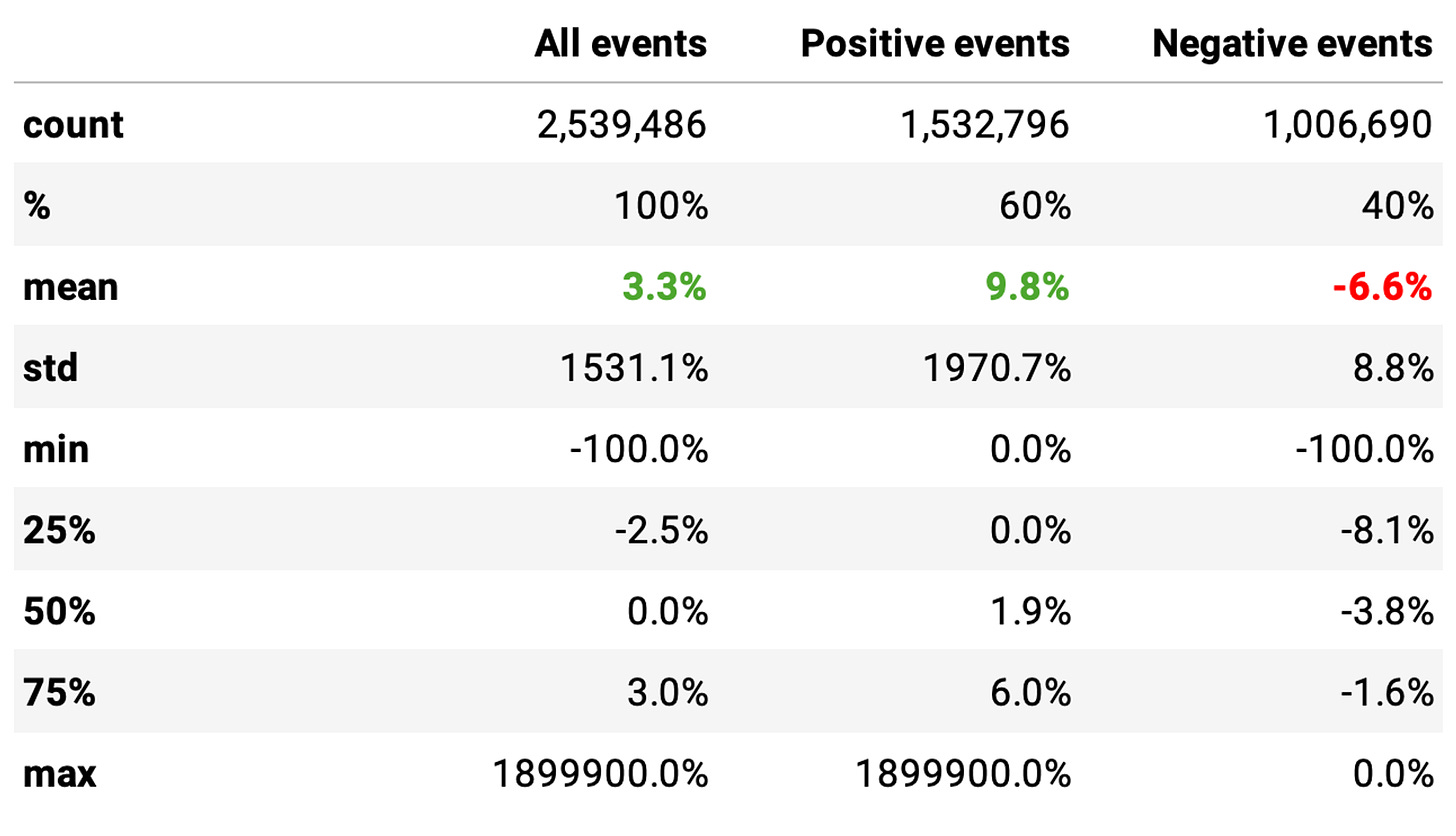
Let's start by verifying statistically if we have an edge and how big this edge is. We begin by looking at what would have happened if we had bought all events when the 2-day RSI closed below 5 and held the position for 5 days, for every stock since 1998 (listed and delisted):
Our universe has over 21 thousand stocks (listed and delisted since 1998). There are over 2.5 million events when a stock's 2-day RSI was below 5, and the market was in a bull regime (S&P 500 closing above its 200-day simple moving average). Here are the highlights:
The mean return of buying any given stock whenever its 2-day RSI is below 5 and holding for 5 days in a bull market is 3.3%;
60% of these events return positively, with a 9.8% expected return per trade;
40% of the trades were negative, with a -6.6% expected return per trade;
The distribution has a positive skew.
Let's see how this compares with non-events: if we had bought every stock whenever its 2-day RSI closed above 5 and held them for 5 days in a bull market.
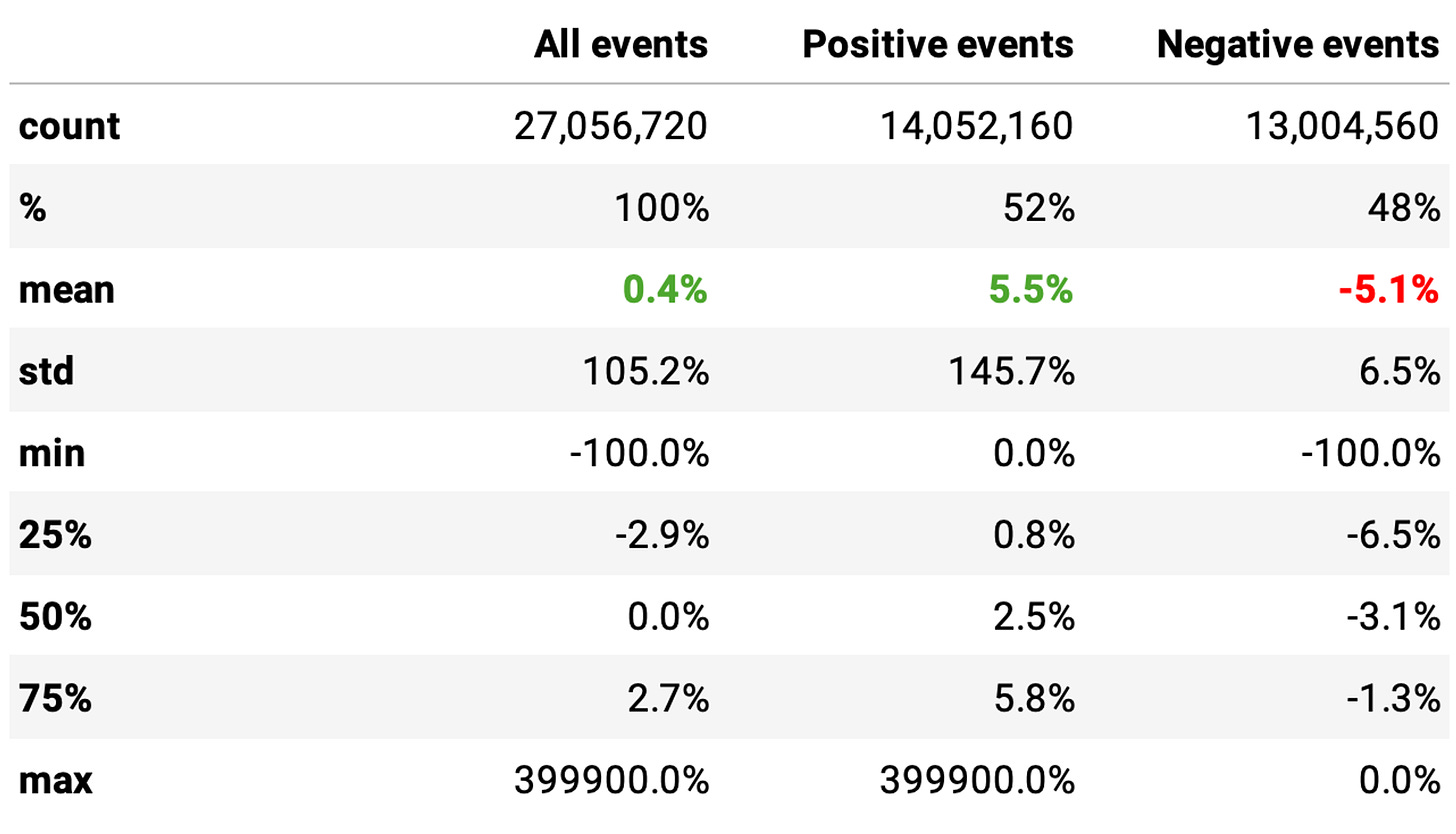
Here, we analyzed over 27 million events. And we see basically a coin-flip:
The expected return of buying any given stock when its 2-day RSI is above 5 is 0.3%;
There's a 52% chance that the trade will turn positive, with an expected return of 5.5%;
There's a 48% chance that the trade will turn negative, with an expected return of -5.1%.
The P-value is well below 0.05: the means of the two distributions are significantly different. So, we have an edge.
Important: We looked into the frequency of the event occurrence per day. This will be important when we formulate a strategy. Here are the main points:
On average, there are 551 stocks on any given day with their 2-day RSI below 5;
This distribution's min, median, and maximum values are 57, 453, and 2,844, respectively.
How does the edge vary with the market cap?
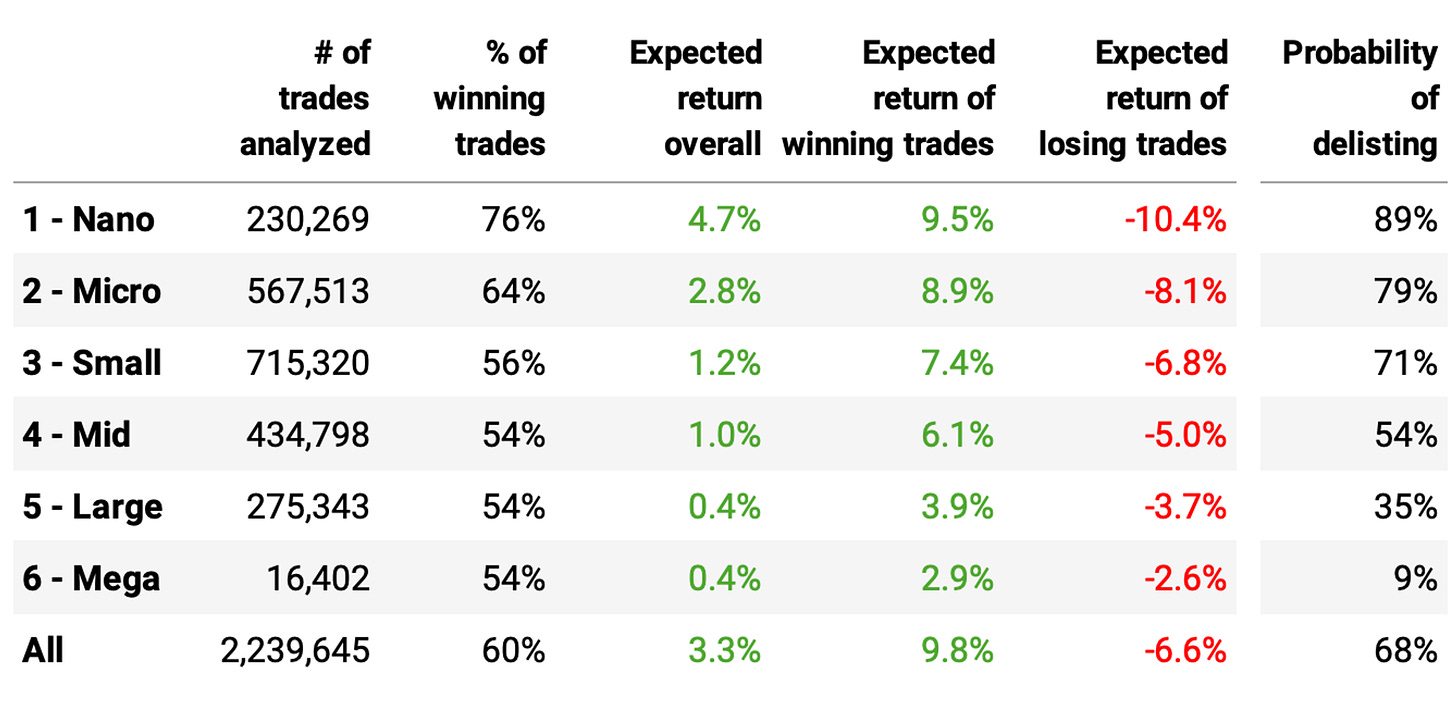
Before moving to the strategy formulation and backtesting, my curiosity provoked me to answer this question. So, we looked into it. Here are the results:
The table above makes several interesting observations. Perhaps the most important is that the lower the market cap, the greater the advantage in buying stocks when their 2-day RSI closes below 5.
This makes perfect sense. The edge of mean-reversion strategies, such as the one we are evaluating now, is probably being competed away in larger cap stocks by quantitative funds. But they are not looking at smaller cap stocks, where the edge still persists and is fat.
Nevertheless, we must balance that with the probability of delisting. There is a 76% chance of a trade turning positive in nano caps, with an expected return of 9.5% (based on 230 thousand trades that happened because the stock was listed). If we factor in that there is an 89% chance the stock will die, the actual number of winning trades would be below 10%.
We want a higher probability of winning trades and a higher expected return overall, but we also want the probability of delisting to be as low as possible. In the experiments, we will explore how to achieve that.
The (simple) strategy
The first strategy I tested was the same one presented by Connors in his book, with small tweaks (trading only on openings and a slightly different exit rule):
The SPY is above its 200-day moving average;
The 2-period RSI of the S&P 500 Index closes below 5;
Buy the SPY on the next open;
If SPY closes above the previous day's high, exit on the next open;
Also, if we are holding a position, and the regime changes from bull to bear (i.e., SPY closes below its 200-day moving average), we exit on the next open.
Experiments
The first experiment was a disaster. Trading this strategy with SPY delivered a 67% return in the whole backtest period (25 years), executing only 157 trades. It isn't good.
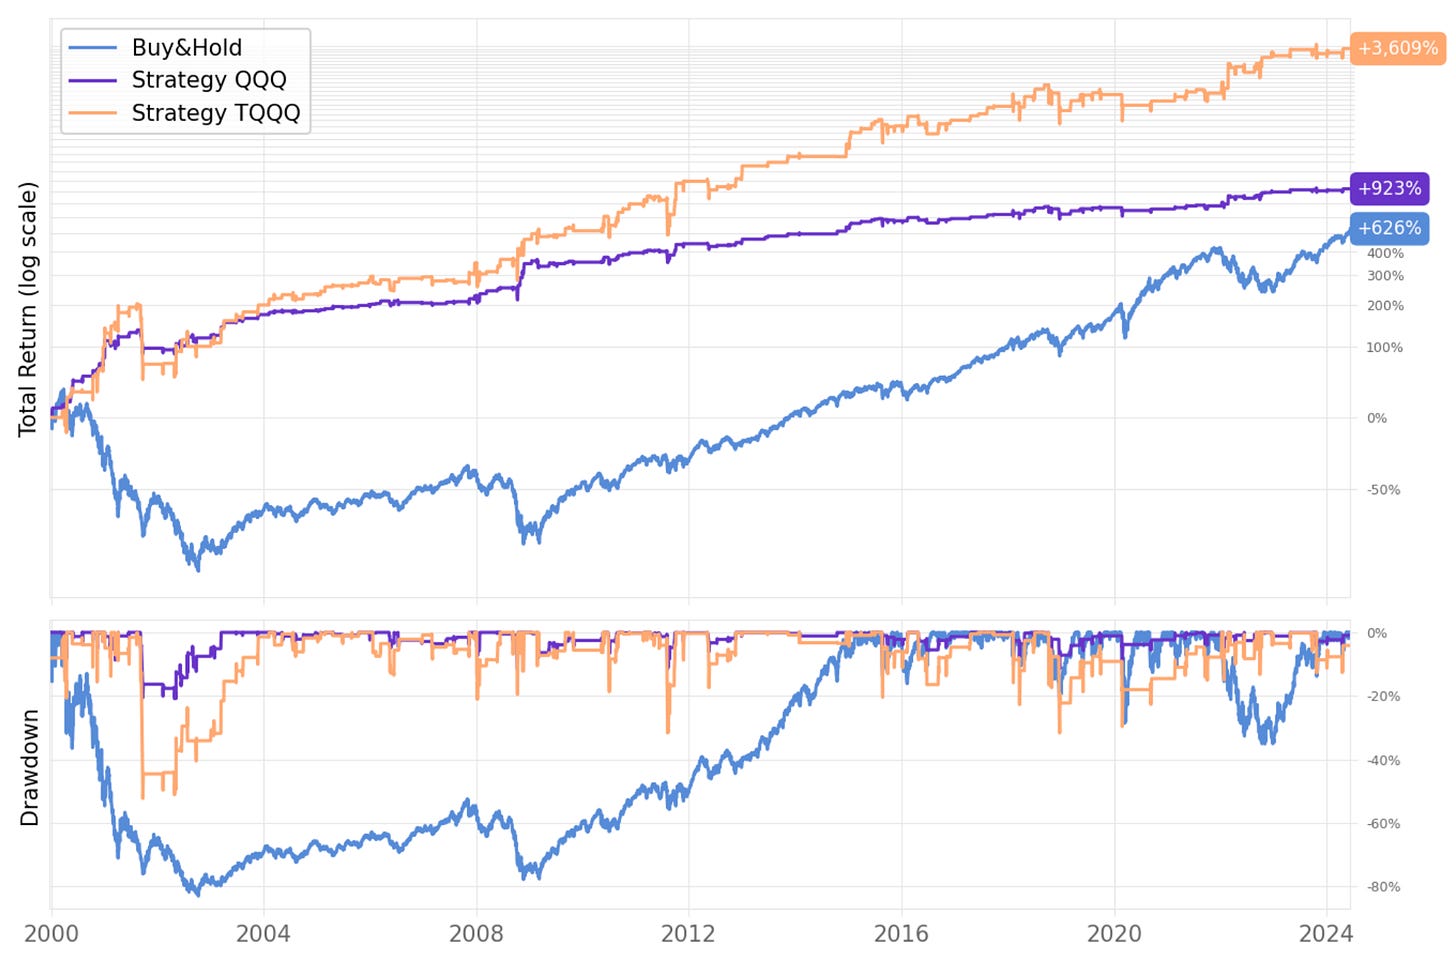
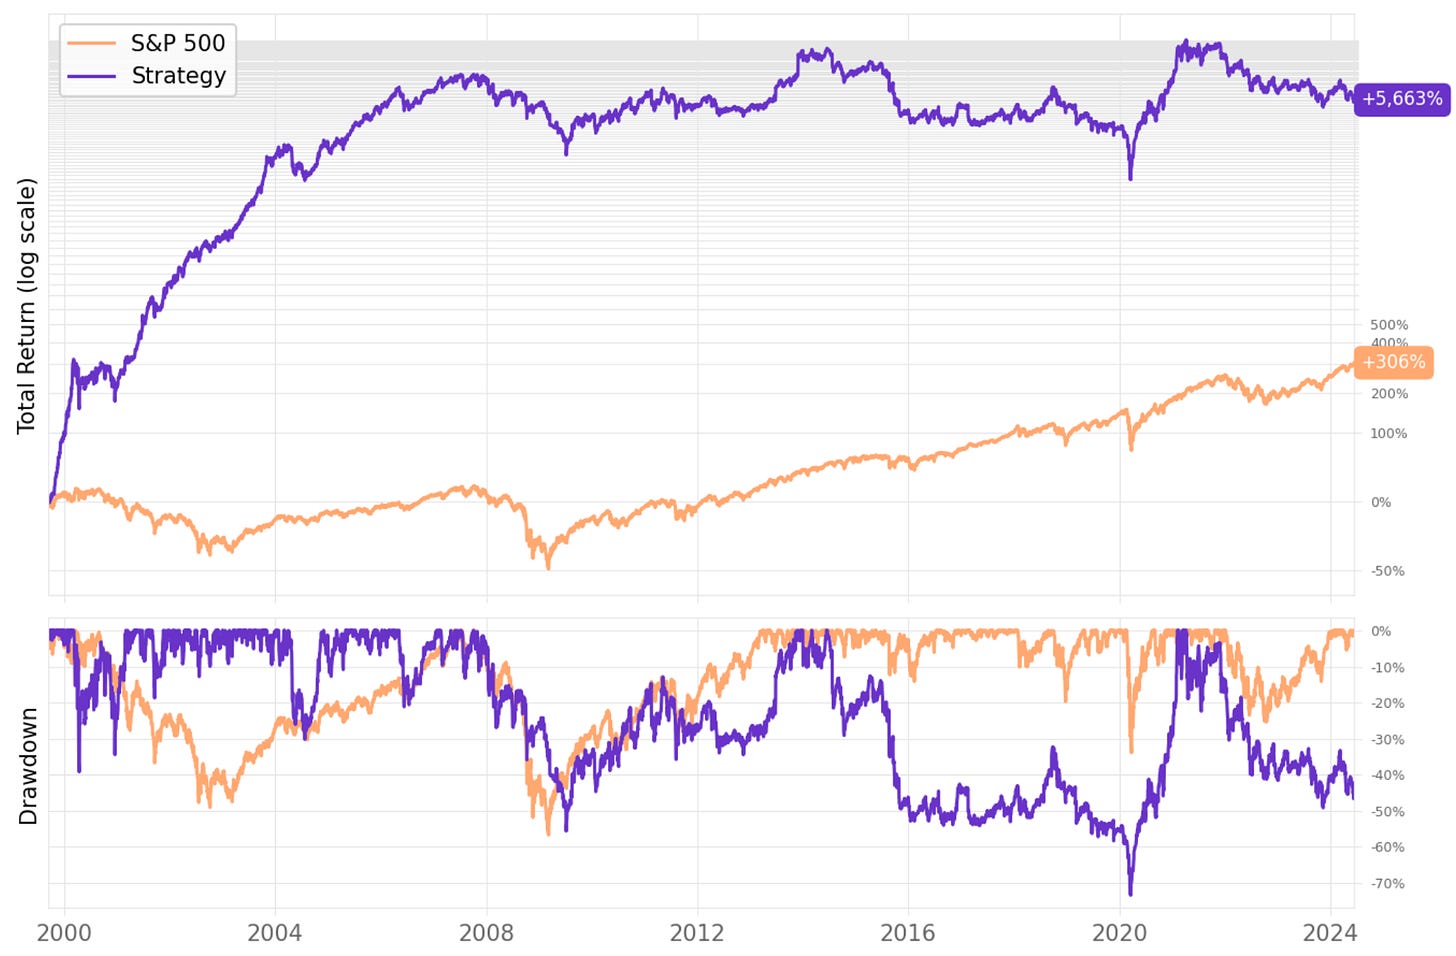
Next, I tried QQQ and TQQQ and saw a better outcome, though not great (yet):
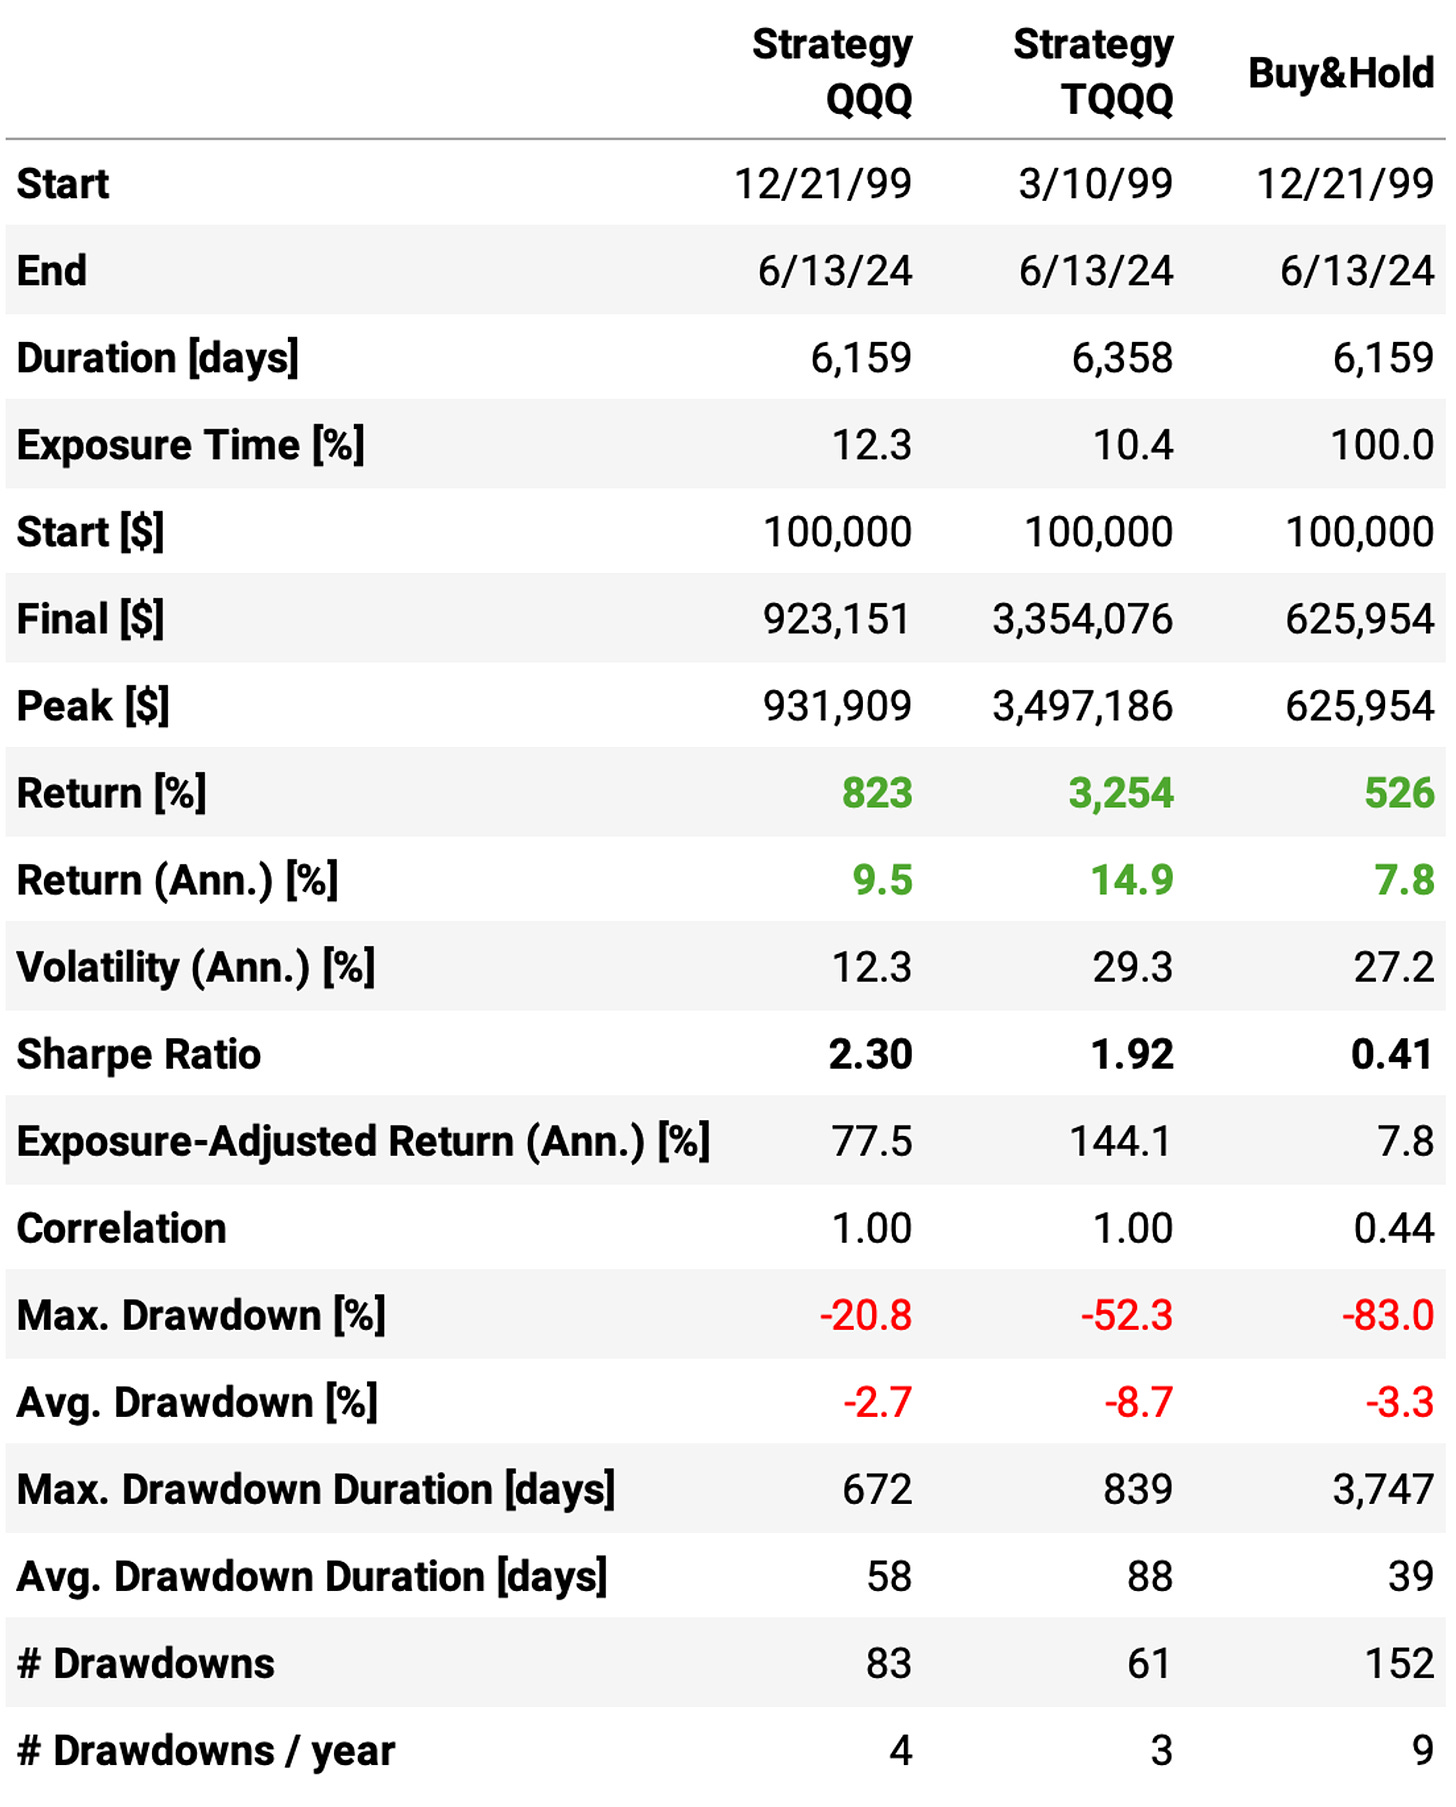
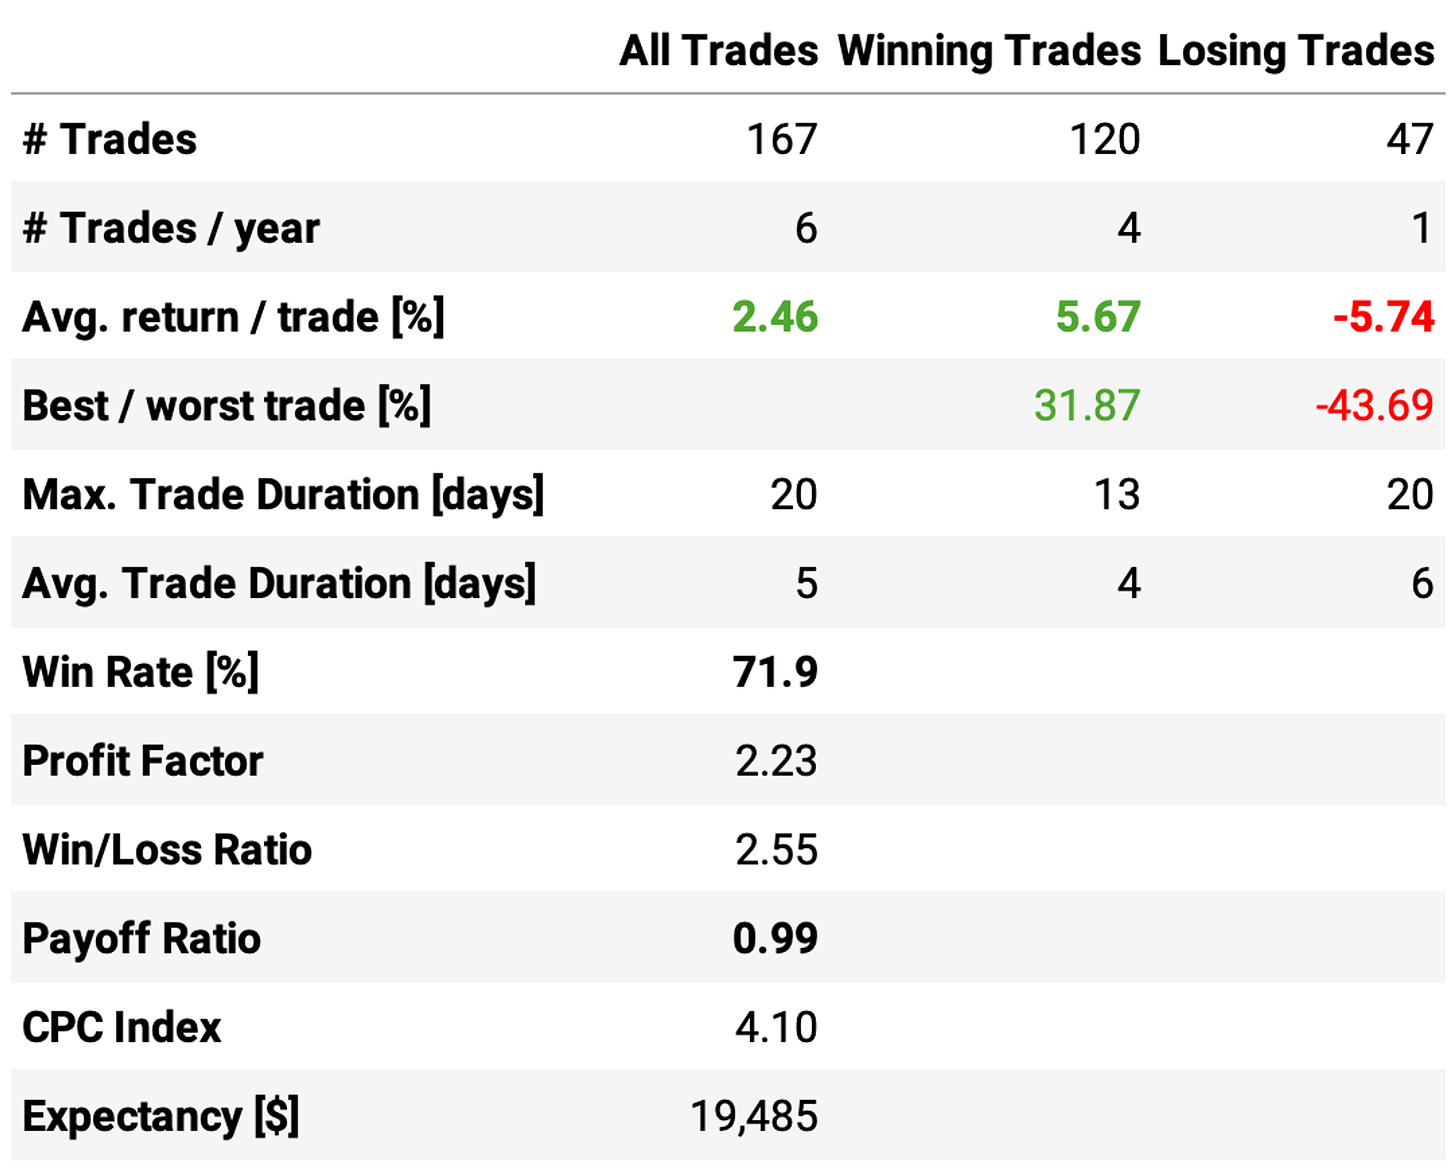
The results are not bad, but they are also not good:
Both experiments, running on QQQ and TQQQ, delivered a good risk-adjusted return with high Sharpe ratios (2.30 and 1.92 respectively);
This was driven by a low exposure time of only 12% and 10%;
We see a high win rate of 72% (TQQQ case), but the number of trades is pretty low: only 167 in ~25 years (only 6/year);
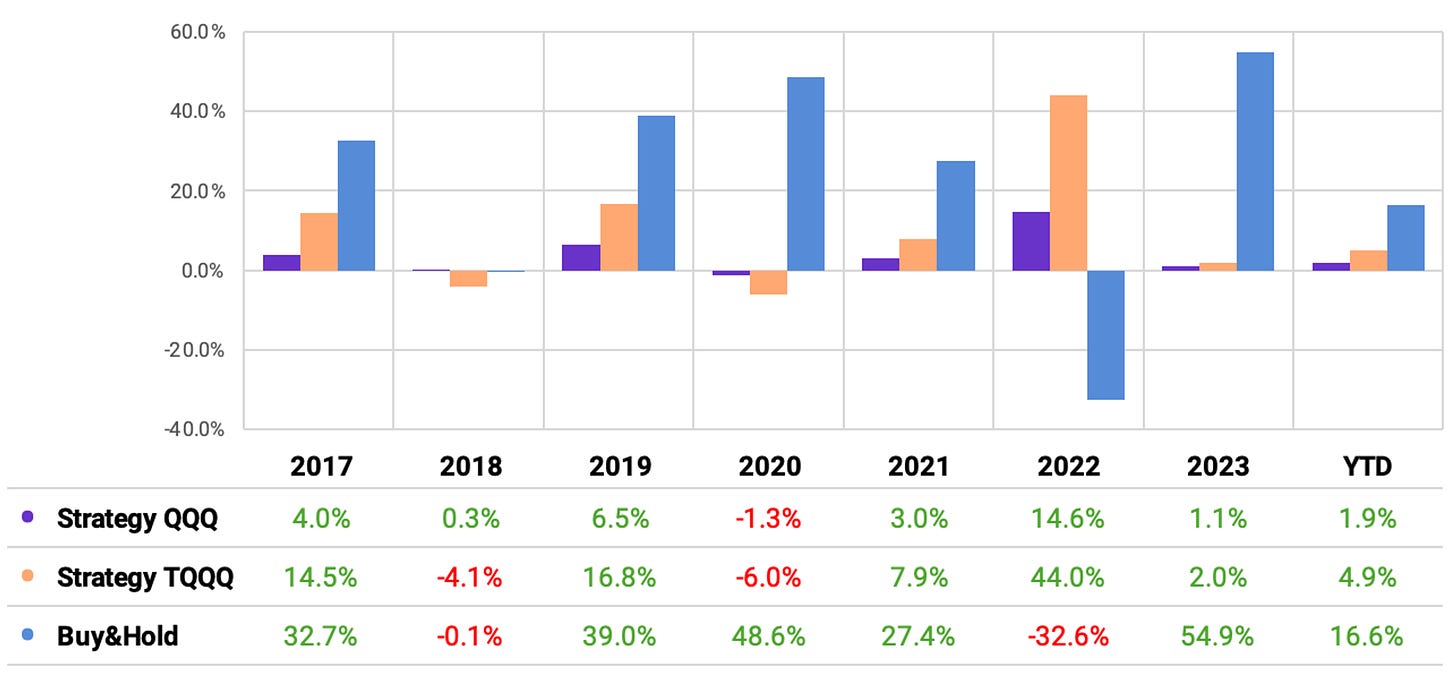
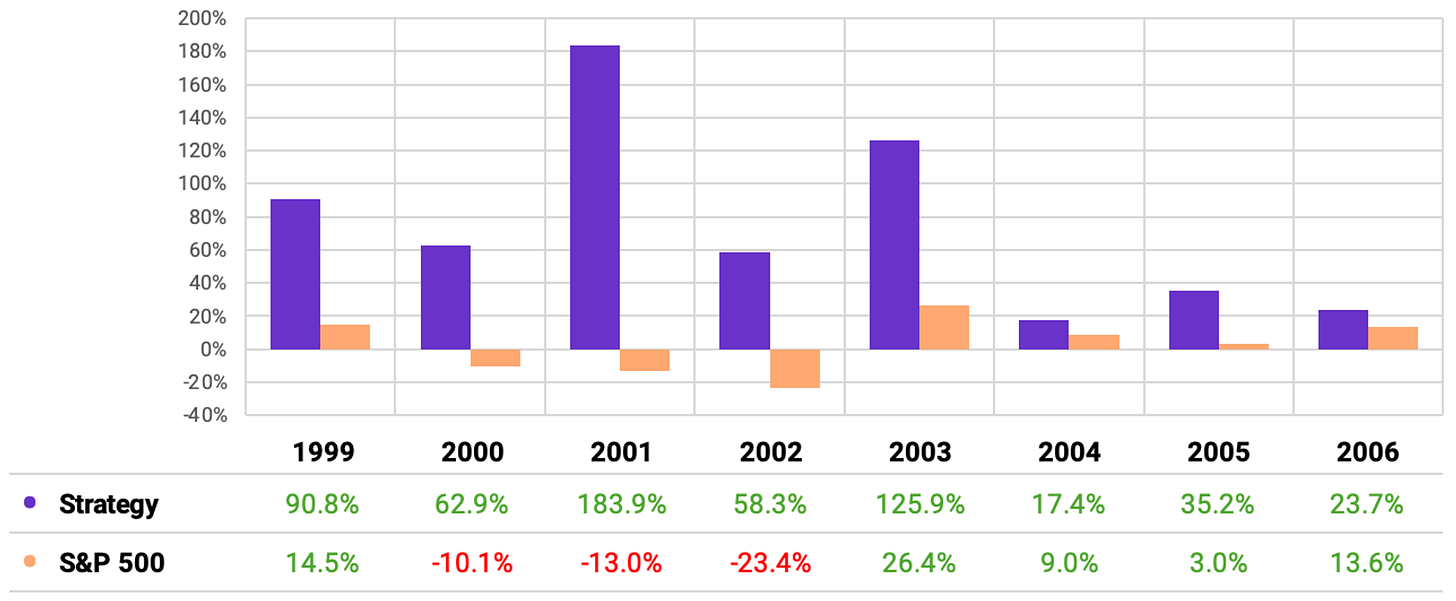
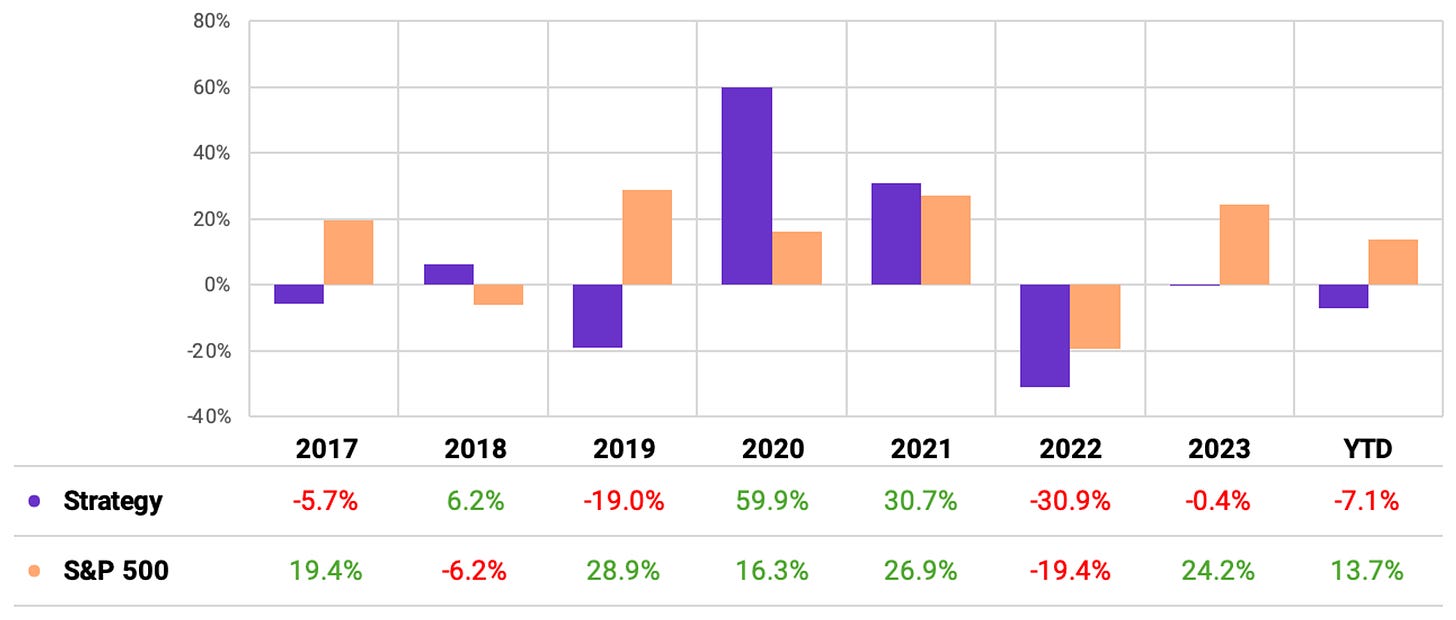
Although both experiments beat Buy&Hold over the 25-year period, most of the great results came from 2000-2010; the strategy would have significantly underperformed Buy&Hold in the last 7 years.
With these favorable trade stats (high win ratio and profit factor), increasing the exposure could significantly increase the returns. Let's see how to do that.
The elaborate strategy
Now, instead of trading a single instrument, let's test an elaborate strategy where we trade several instruments in parallel.
This was not in Connor's book, it's an original idea - but I suspect he'd done something like this for himself. Here are the rules:
At the opening of every trading session:
We will split our capital into 10 slots and buy stocks whose 2-day RSI from the previous day closed below 5;
If there are more than 10 stocks in the universe with the entry signal triggered, we will sort them by market cap and prioritize the smaller ones;
We will hold 10 positions maximum at any given moment;
When the stock closes above yesterday's high, we will exit on the next open.
To ensure we only trade liquid stocks:
We will restrict ourselves to only trade stocks that have been traded in all sessions over the past 3 months from the day in question;
We will only trade the stock if the allocated capital for the trade does not exceed 5% of the stock's median ADV of the past 3 months from the day in question.
Again, if we are holding a particular stock and it closes below its 200-day simple moving average, we sell at the next open.
New experiments
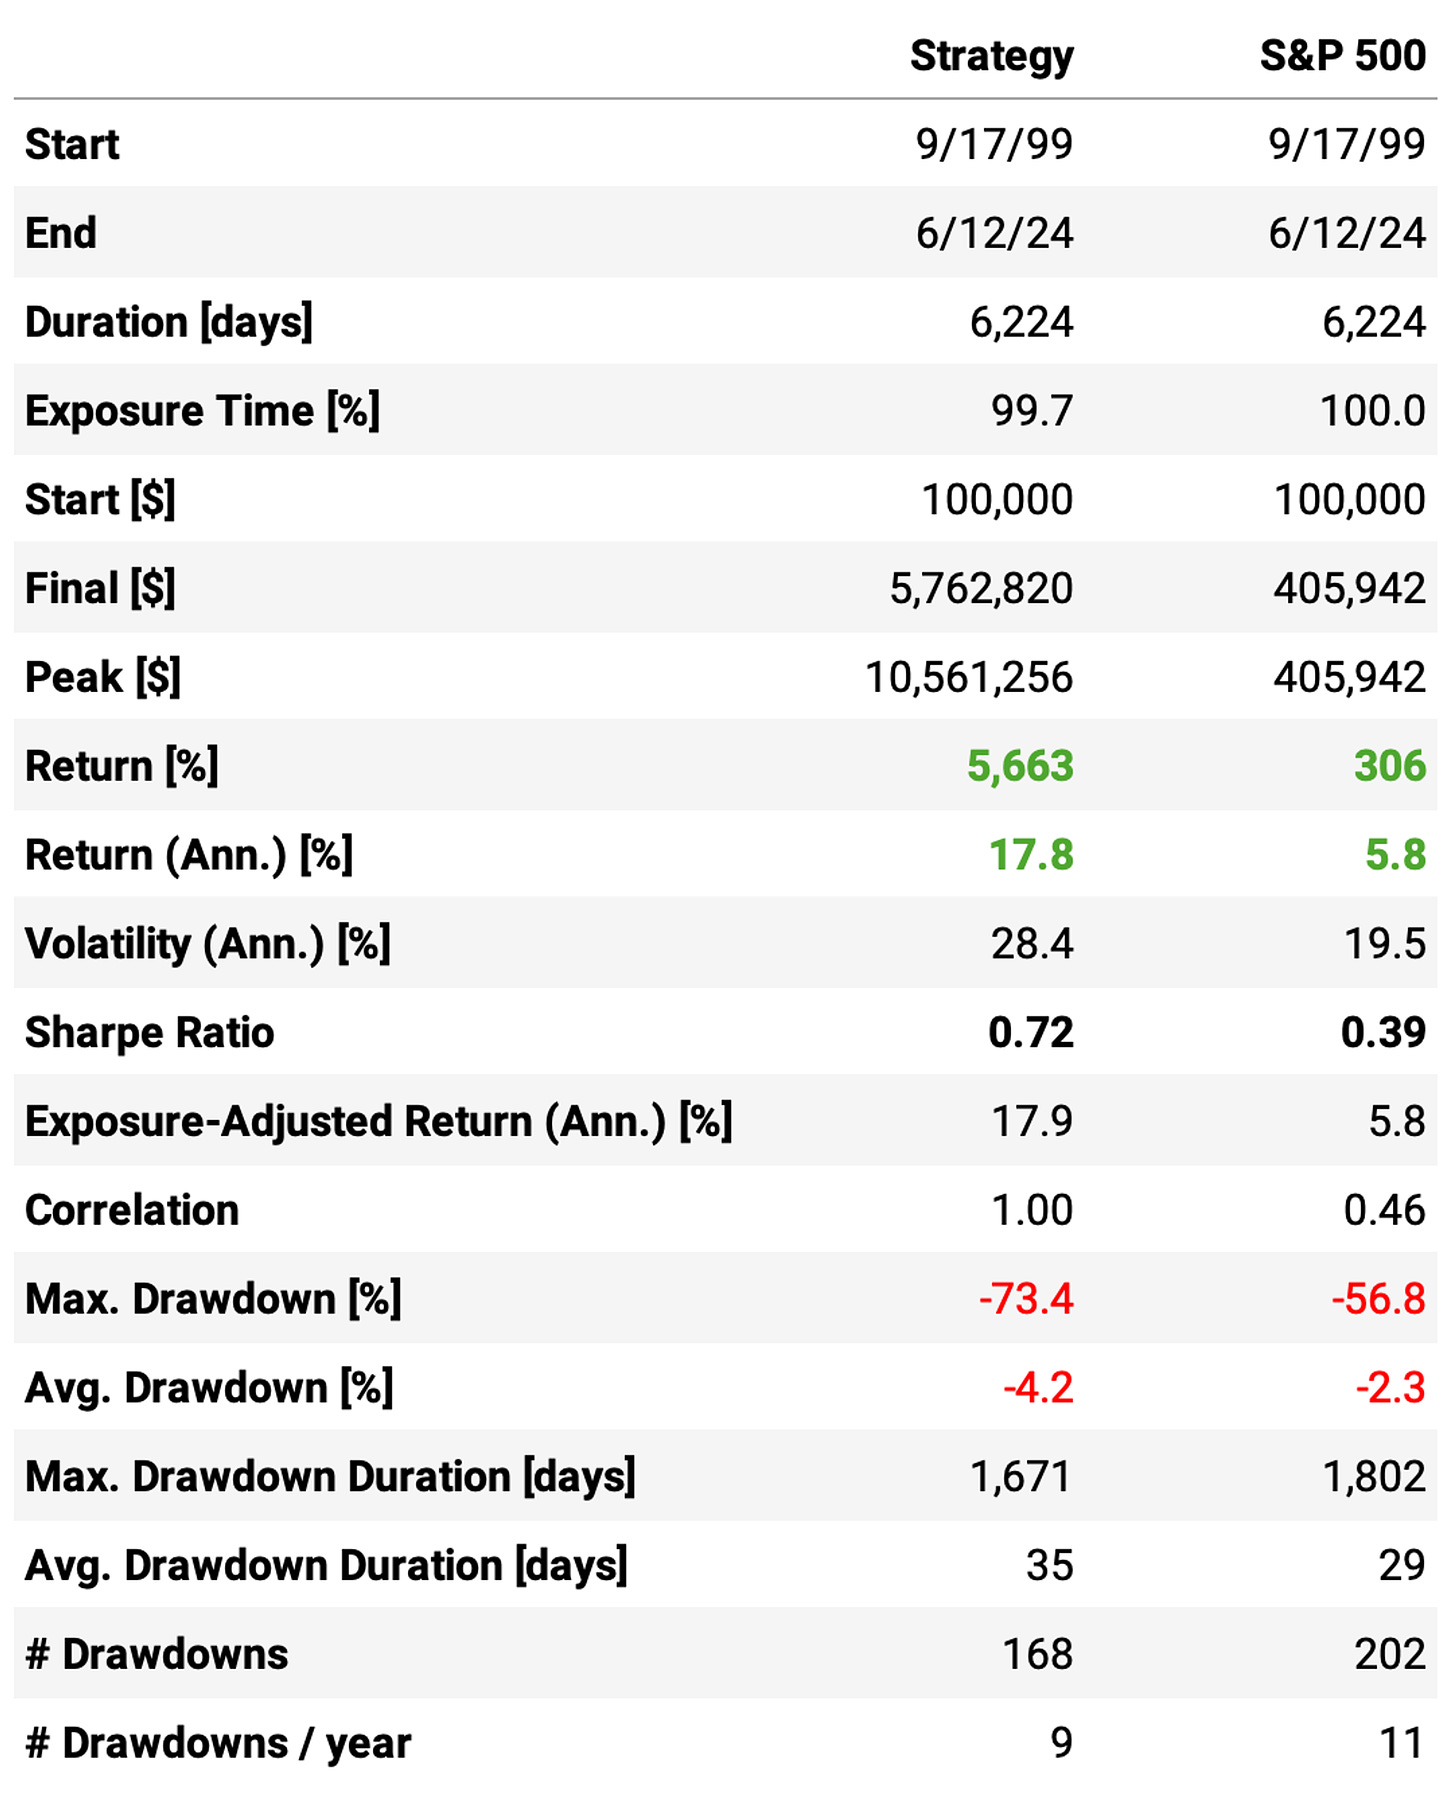
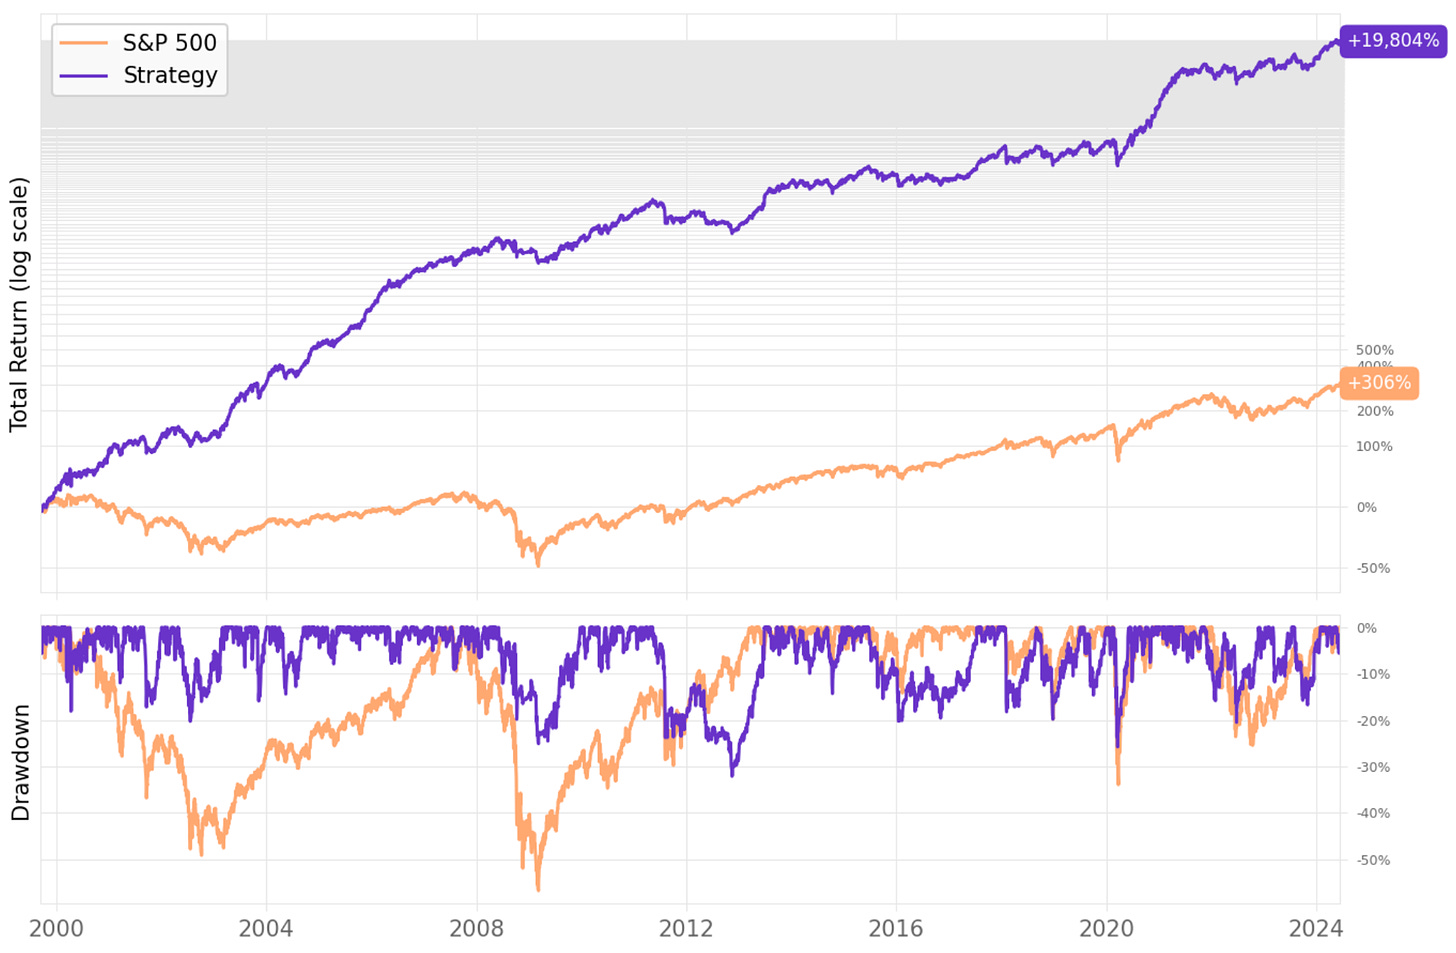
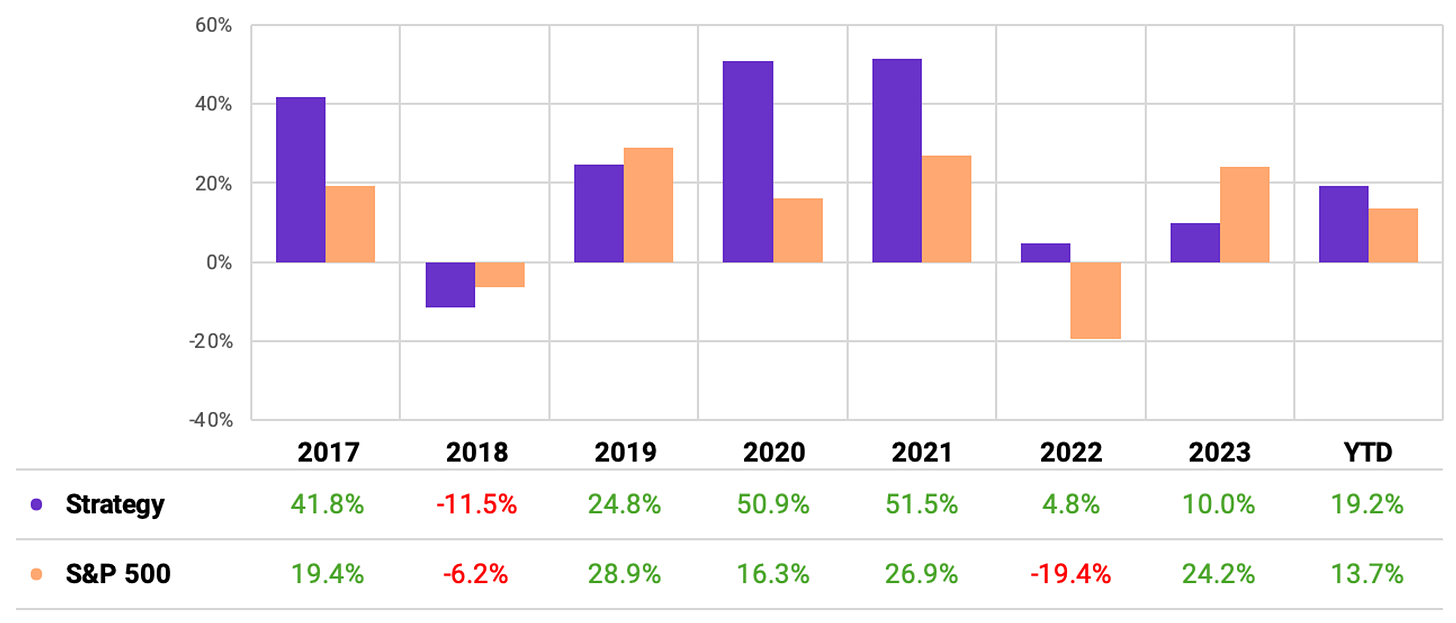
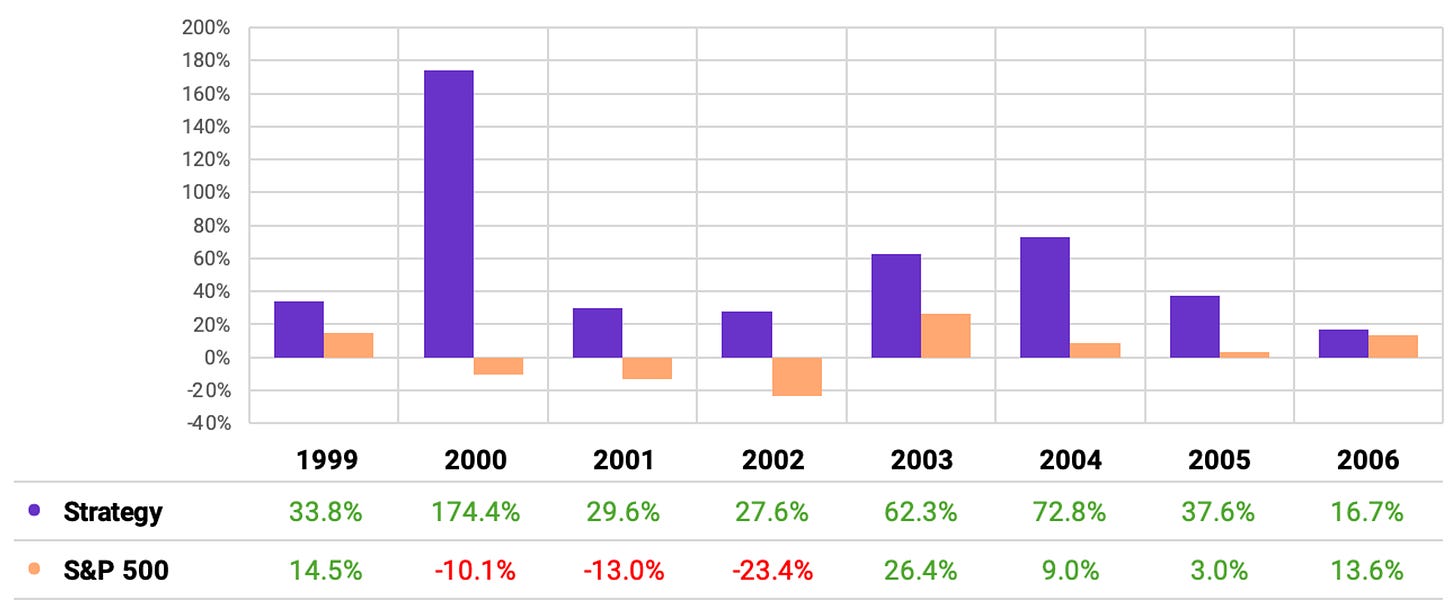
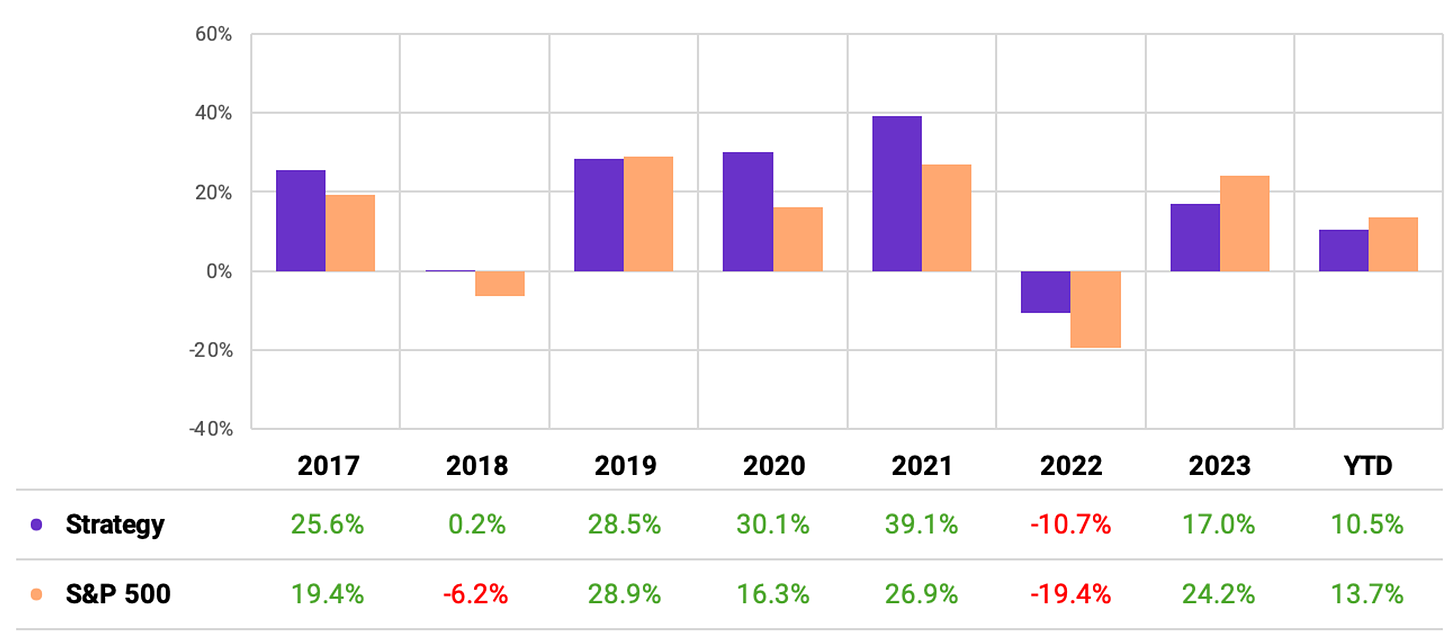
I was surprised by the first results. The strategy massively works until 2008, then it stops working and struggles until this day:
Several conclusions can be drawn from the data above:
Although the overall annual return is 17.8%, almost 3x the benchmark, all of it was achieved in the first 8-9 years. The strategy stops performing after 2008 and loses to the benchmark from that point on;
The volatility is pretty high, which generates a low Sharpe ratio (0.72), a maximum drawdown higher than the benchmark, and average drawdowns 2x larger than the benchmark;
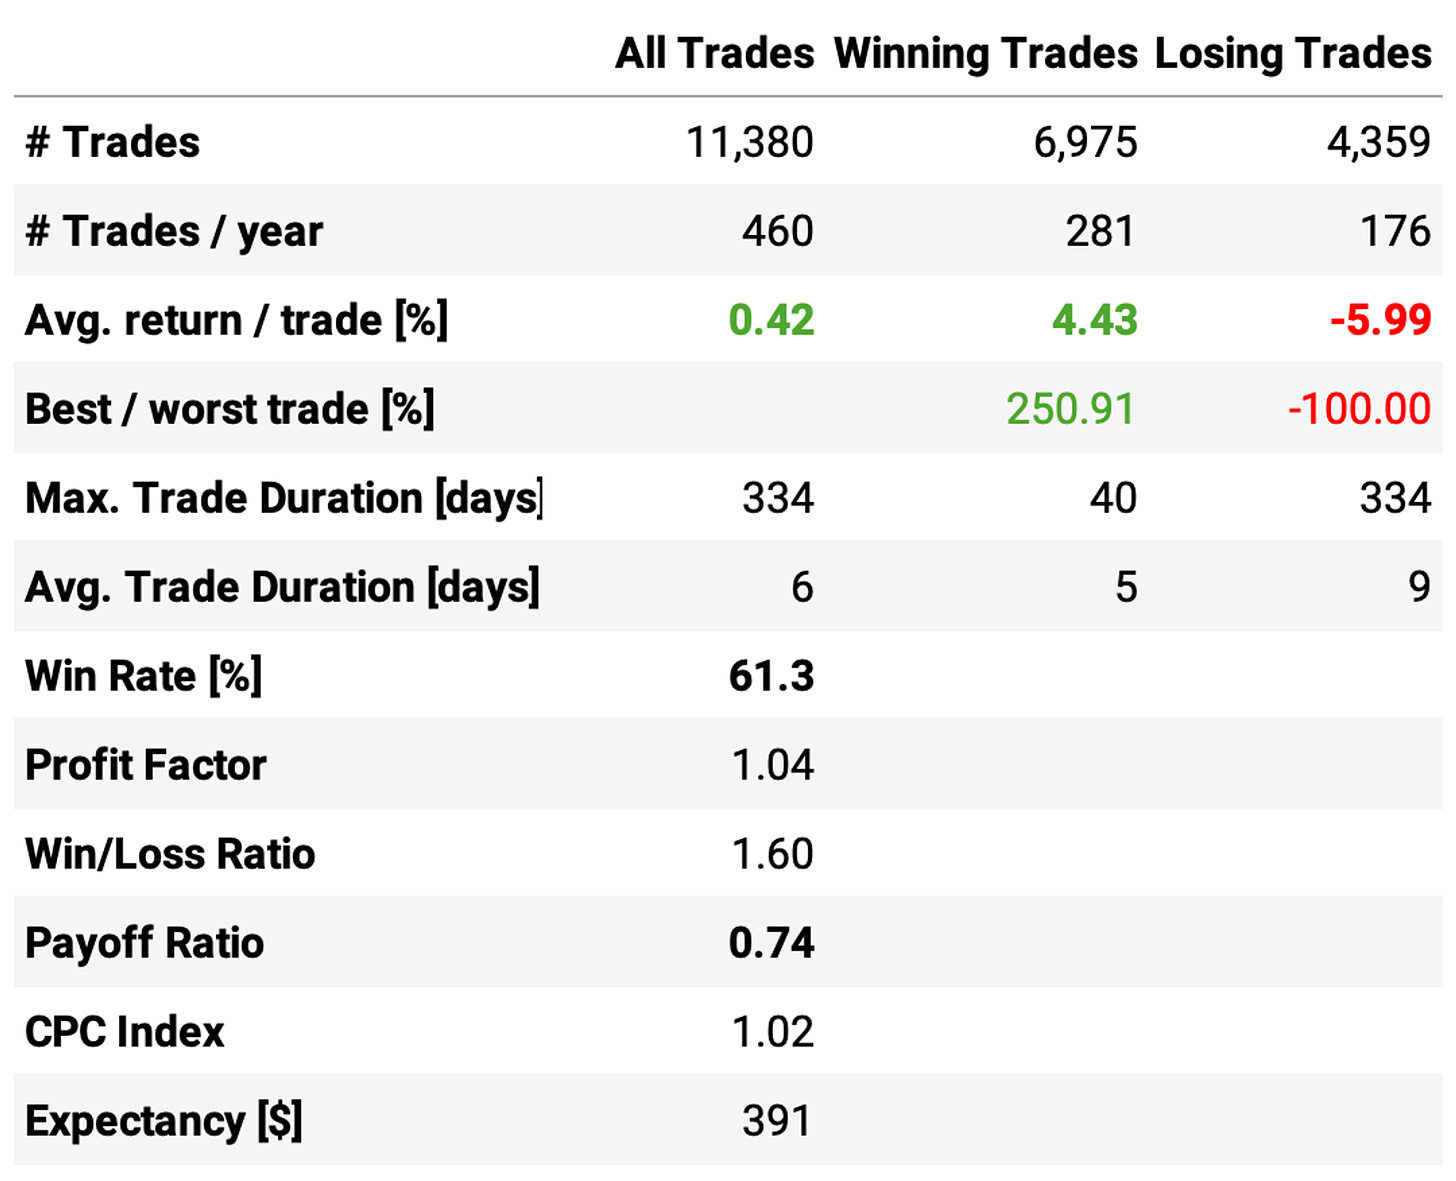
The strategy trades a lot: 460 trades/year is ~2 trades/day (and every trade is two transactions);
The win rate drops compared to the first experiments, and the payoff ratio gets really unfavorable at 0.74: the average return/trade of the losing trades is -6% compared to +4.4% on the winning trades.
Analyzing the 11,380 trades made throughout the 25 years of backtest, I found many delistings. The problem with this naive approach was that the strategy prioritized small caps (after passing through the liquidity filter), and they have a +70% probability of delisting. How can we fix that?
Reducing the risk of delisting
To reduce the risk of delisting, we experimented by restricting ourselves to trading only large and mega caps, which have a low probability of delisting (35% and 9%, respectively).
We maintain the priority criteria: Whenever we have more than 10 stocks with the buy signal triggered on any given day, we prioritize the smaller ones within this universe.
The results are significantly better:
These are much better results:
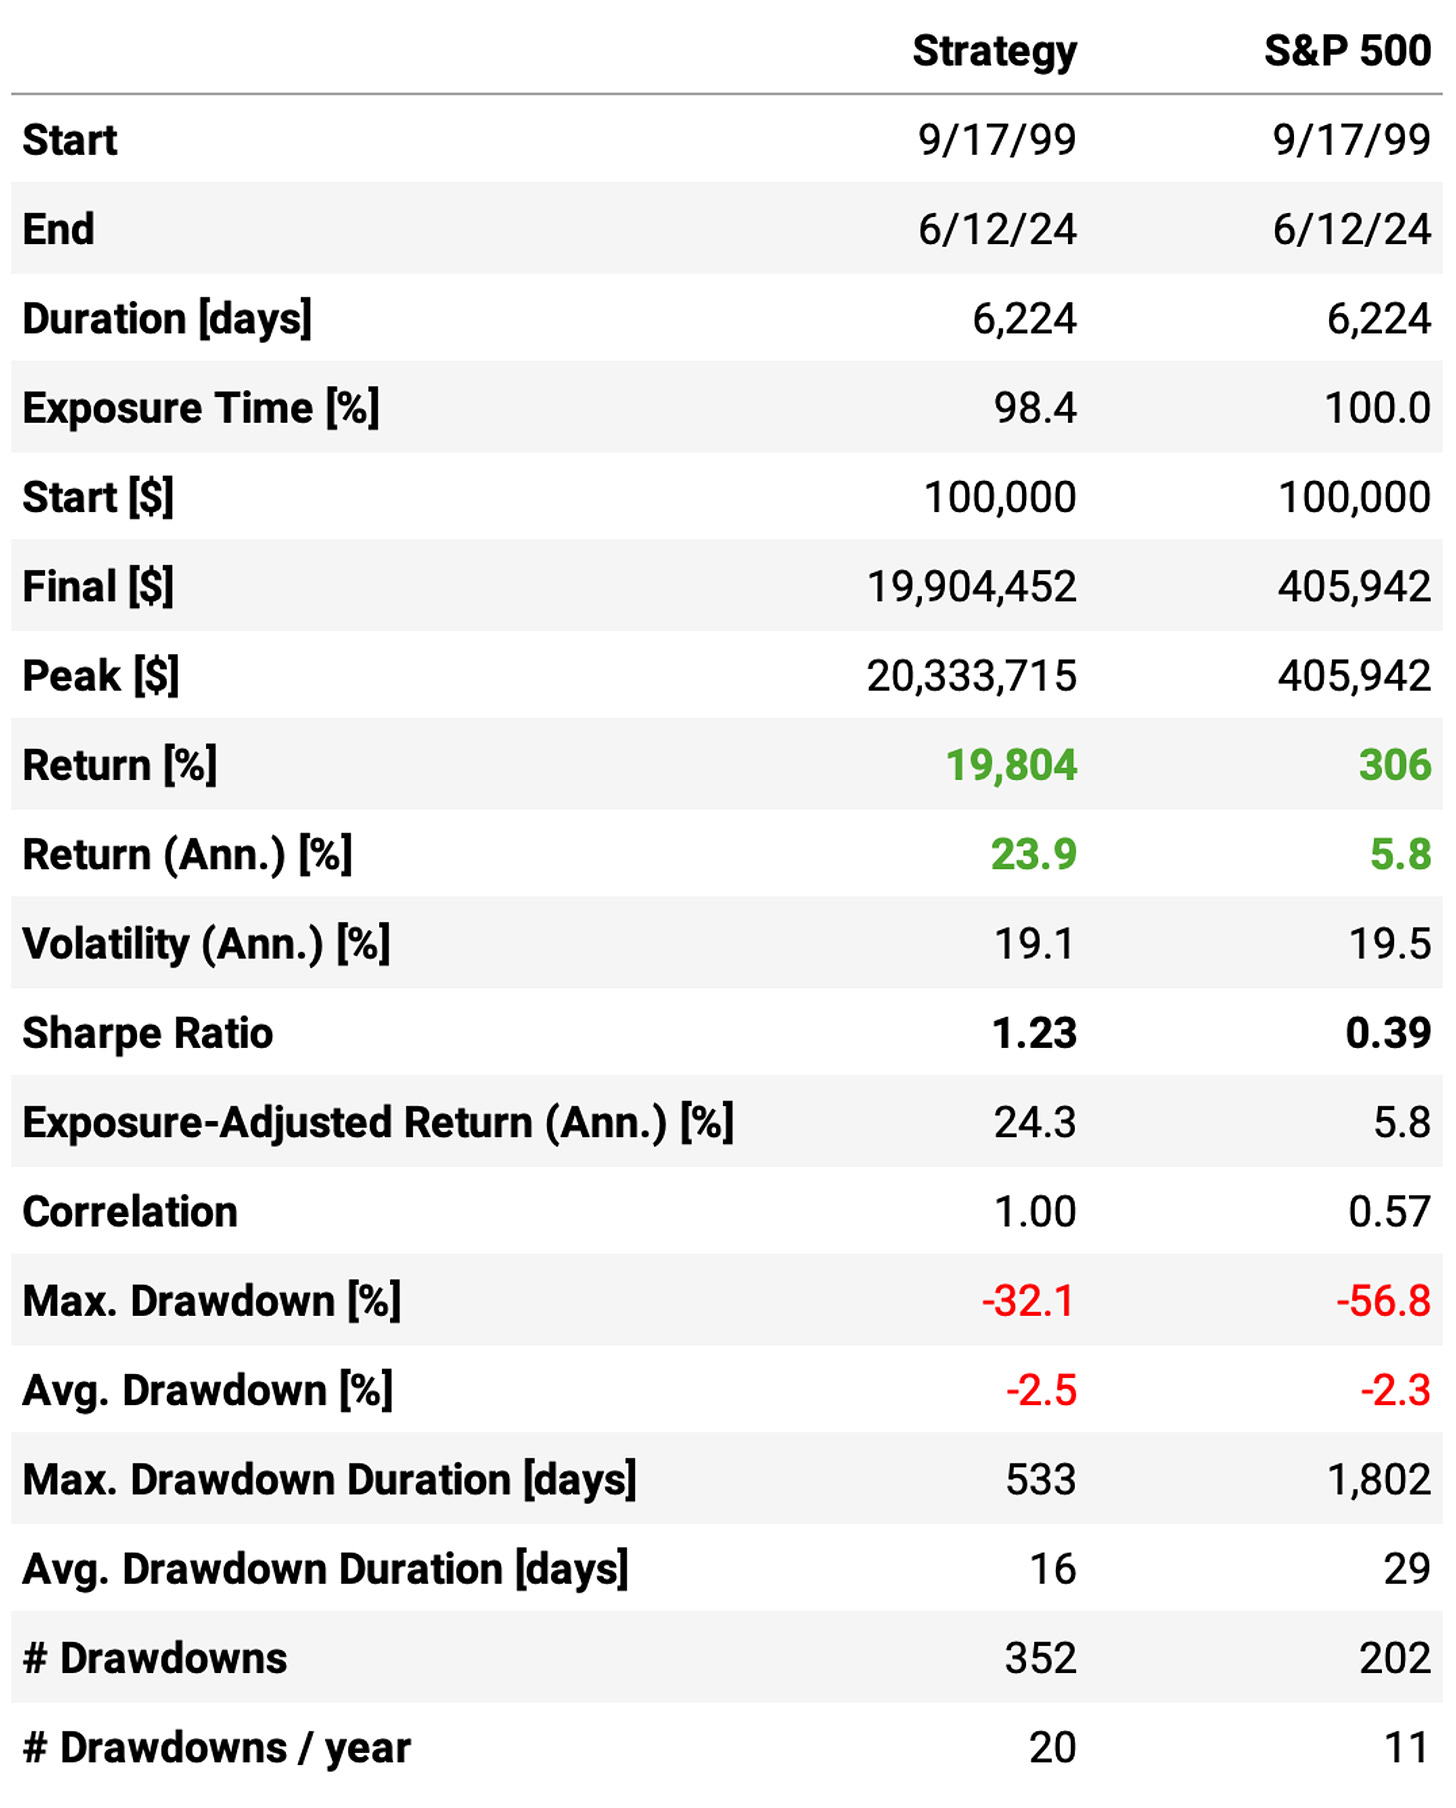
Restricting the universe to large and mega caps made the strategy deliver 23.9% annual return, 4x the benchmark in the same period;
The Sharpe ratio hits 1.23; the maximum drawdown is 32%, almost half of S&P 500's;
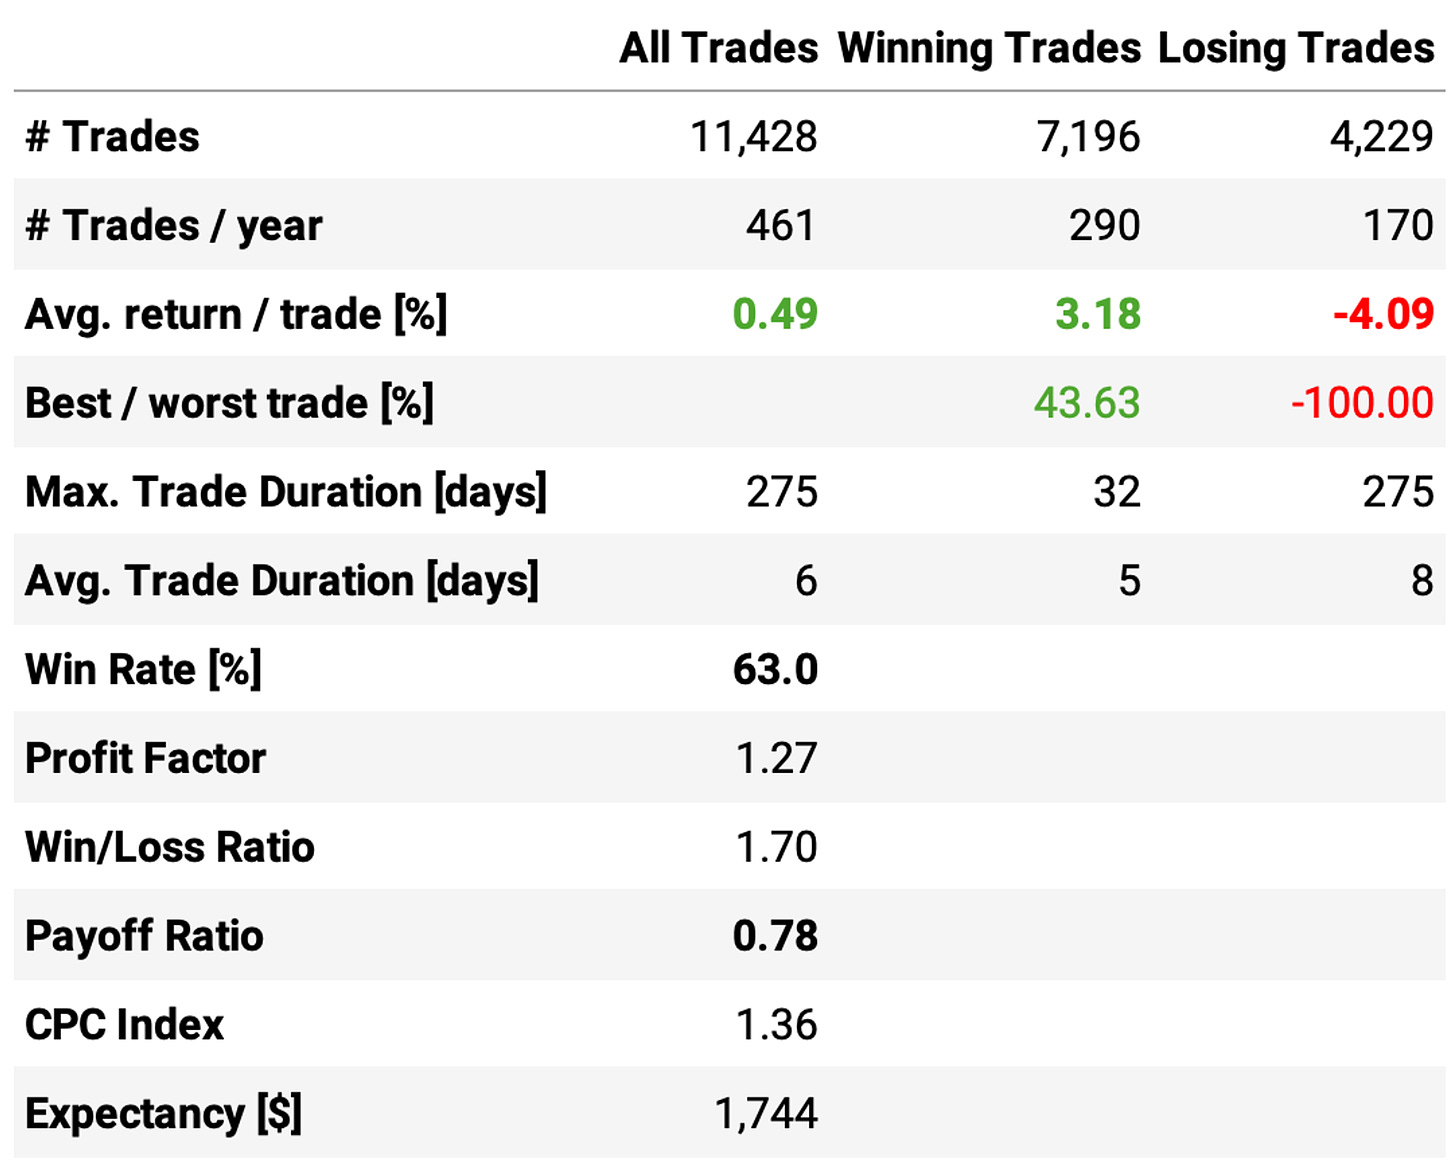
The win rate improves a bit, reaching 63%; the payoff ratio improves as well to 0.78 (although not yet favorable);
But we continue with a pretty high number of trades: 461/year.
Next, we experiment with the maximum number of positions held: 10 might be too high.
Reducing the high number of trades
My first idea was to reduce the maximum number of positions held at any given moment to 1 to reduce the high number of trades.
Then I thought: there's still a delisting risk. It's lower for large and mega caps, but it still exists. So, I settled for 2, which generated the following (impressive) results:
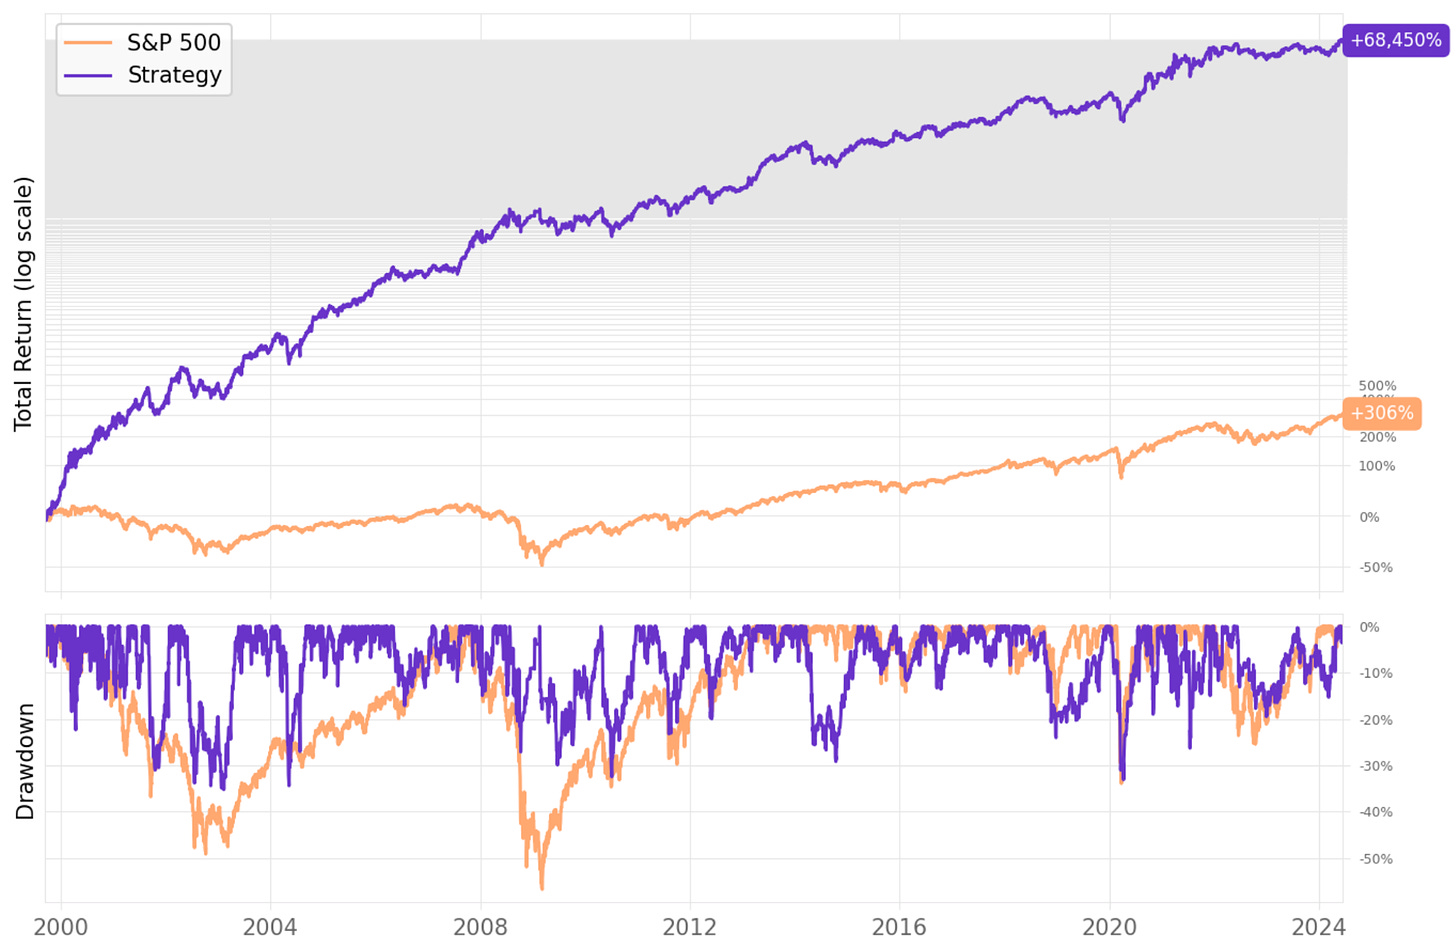
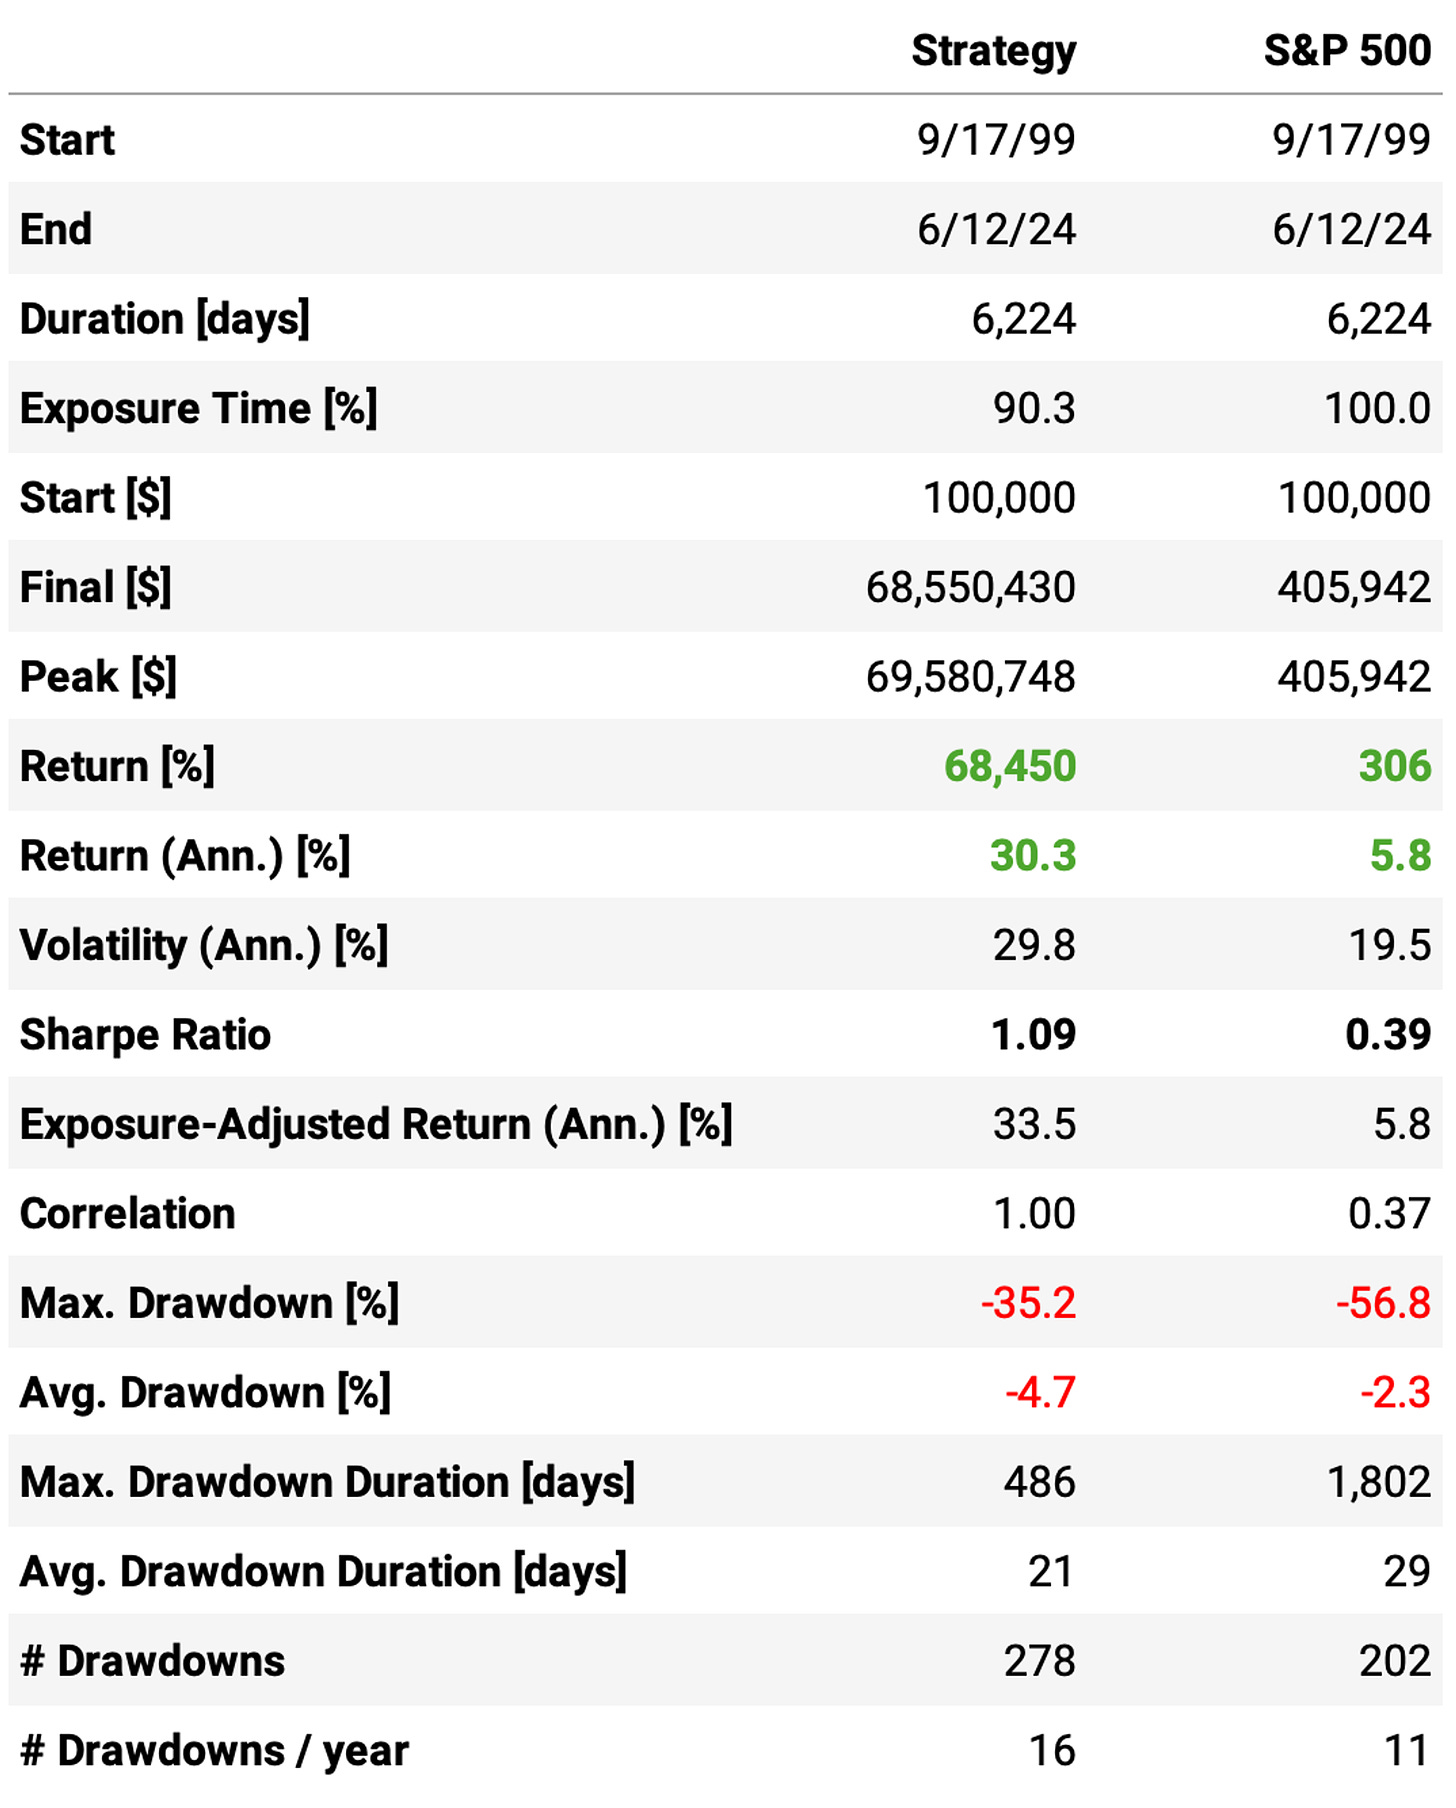
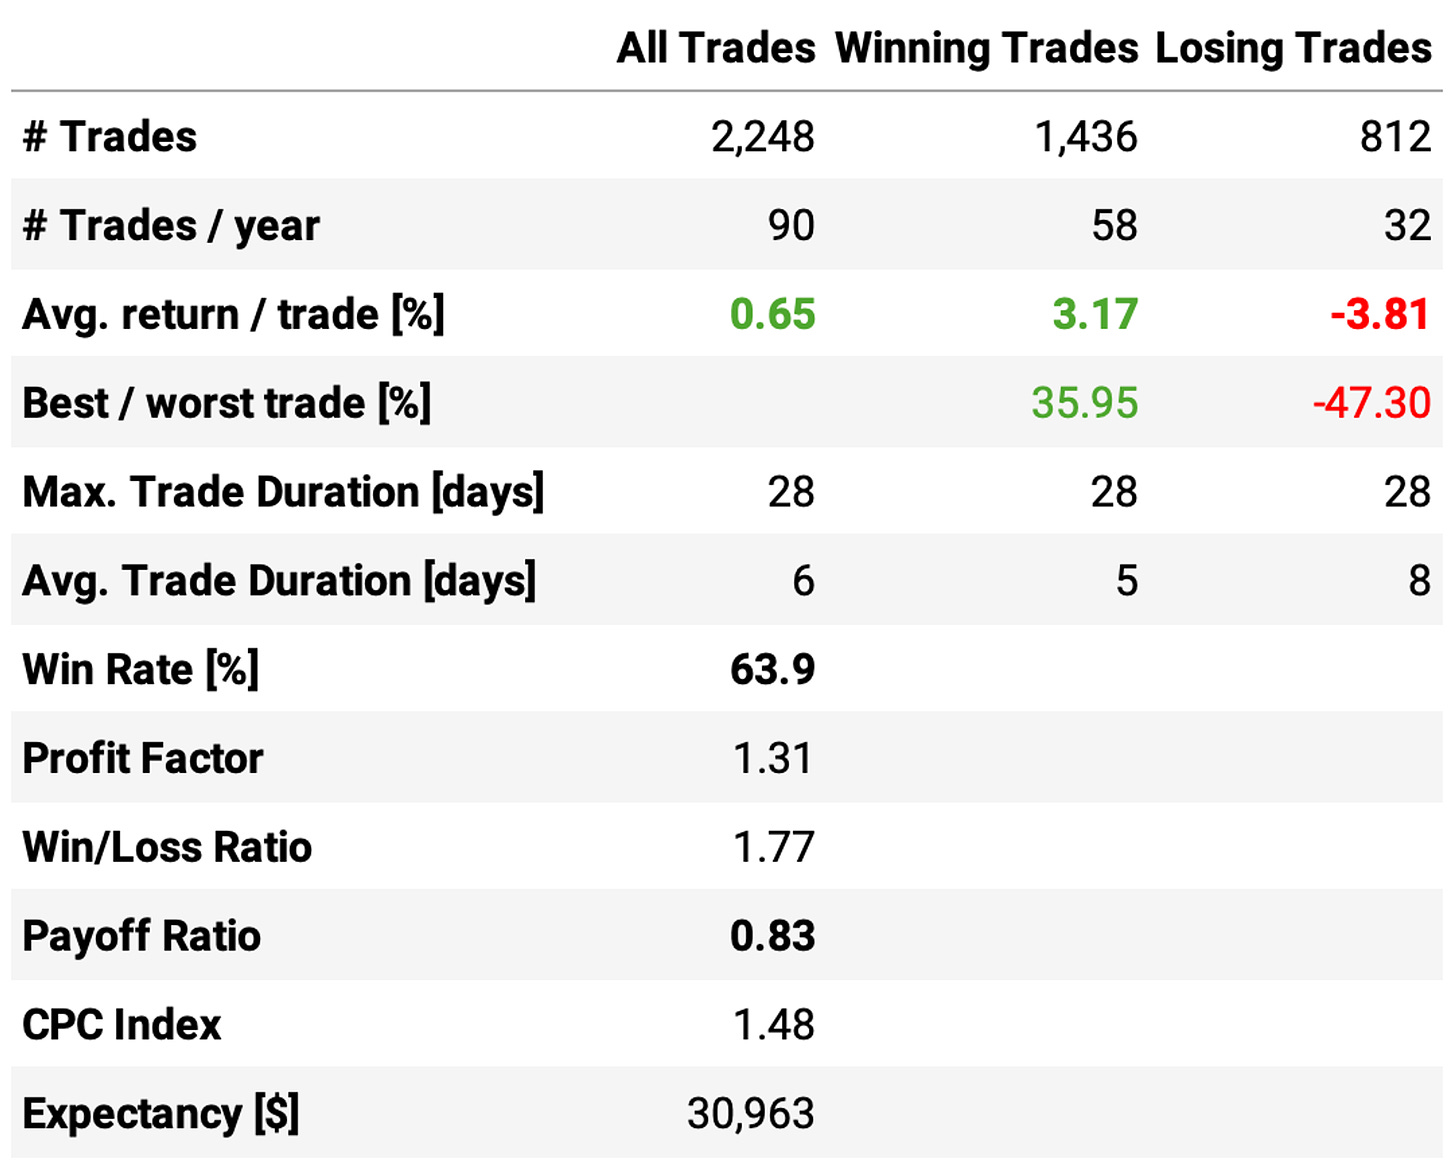
Reducing the maximum number of positions held from 10 to 2 led to a dramatic reduction in the number of trades: from 461 trades/year to 90 trades/year (less than 2/week).
And the overall results were impressive:
The strategy achieved a 30.3% annual return, 5x the benchmark;
The Sharpe ratio reduced from 1.23 to 1.09, but still good;
The maximum drawdown increased a little bit to 35%, but still significantly below the benchmark;
The experiment achieved a 64% win rate and improved the payoff rate to 0.83.
But is this strategy robust?
As explained, the strategy prioritizes lower market cap stocks. We saw that the lower the market cap, the higher the edge. To finalize this study, I decided to run 100 experiments. In each one, instead of prioritizing the lower market cap stocks in selecting what to trade, I randomly selected 2 at the beginning of each trading session.
Here are the results:
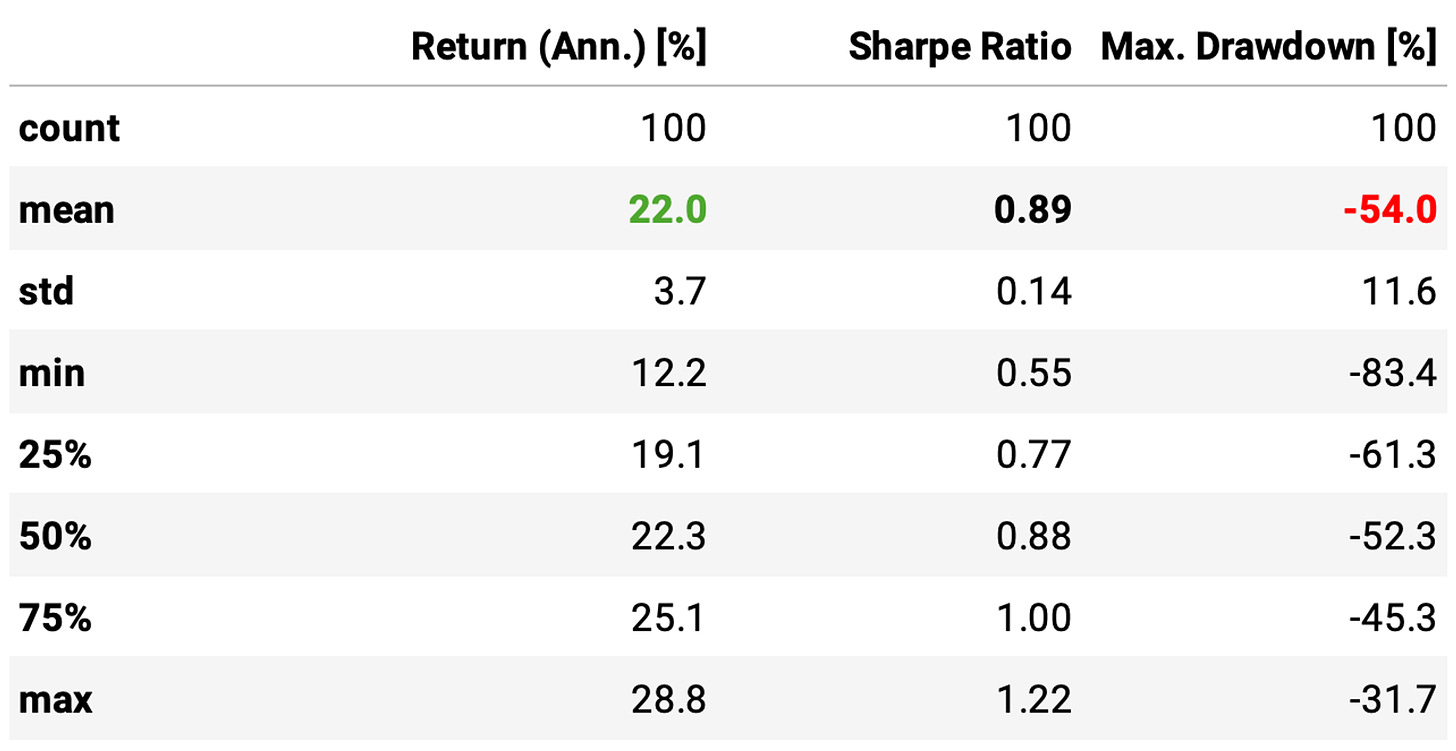
The annual return, Sharpe ratio, and maximum drawdown all get worse. This is expected. We are no longer selecting the best opportunities at the beginning of each trading day; we are randomly picking them.
Nevertheless, it's interesting that even randomly selecting the opportunities when 2-day RSI breaks below 5 leads to a performance well above the benchmark. Indeed, this suggests that the 2-day RSI remains a powerful signal for mean-reversion.
Final thoughts
This article ended up way longer than I expected. And I struggled to write it. So, I will be brief. The first question is: Should we trade this strategy?
Personally, I don't like the 35% maximum drawdown. In fact, I think anything higher than 20% is too much. I'm forward-testing it, so we will see how this strategy behaves with live data from now on. But as is, I don't think I would trade it. There are more experiments I want to try before deciding on this.
As a matter of fact, although I tried dozens of different setups for this strategy while writing this (99% never makes it into the final article), there are some ideas I'm keen to explore soon:
Cumulative RSI. In his book, Connor explains 2-day RSI but quickly moves to cumulative RSI. This would be the natural next step.
Sector ETFs. In the article, we experimented with 2 extremes: trading a single instrument and trading tens of thousands of instruments. My intuition says that something in-between, like sector ETFs, might work surprisingly well.
Machine learning. This topic is more advanced, but I believe feeding mean reversion signals to a simple ML model and training it to predict the probability of a stock to mean-revert in the near future might work.
All are ideas for future posts. So many ideas, so few time…
I'd love to hear your thoughts about this approach. If you have any questions or comments, just reach out via Twitter or email.
Also, if you want to implement this strategy and need help, just let me know.
Cheers!


Great article. Where do you get accurate point in time market cap data? Seems really difficult to obtain for retail traders.
Entering at the next open significantly reduces the edge.