
The edge in trading IPOs: 18% annual return
A strategy that beats S&P 500 with 3x its return and 1/3 of its drawdown
"An IPO is like a negotiated transaction - the seller chooses when to come public - and it's unlikely to be a time that's favorable to you." Warren Buffett
The idea
Marsten Parker is a self-taught programmer and systematic trader with over 20 years of experience in the trading world. He is best known for being featured in Jack Schwager's book, "Unknown Market Wizards," where he is highlighted as the only purely systematic trader in the series.
His strategies have delivered an average annual compounded return of 20%, significantly outperforming the S&P 500.
"It's so simple that it's stupid." With this sentence, he introduced his IPO strategy in a podcast interview. Different than what motivated Buffett to say his famous quote about IPOs (Buffet usually buys and holds), Marsten's strategy consists of frequently buying and selling IPOs, holding the positions for just a few days. The rules, as he explained:
Define an IPO as any company recently listed (e.g., in the past 90 days);
Whenever the stock closes at a new all-time high, buy;
Put a profit target order and a stop-loss order on the day you buy.
It doesn't get simpler than that.
The edge in buying IPOs at all-time highs
Before backtesting, I decided to investigate deeper. Let's quantify the edge in buying IPOs at all-time high.
First, let's check the returns after 20 days of all all-time high events of non-IPO stocks:
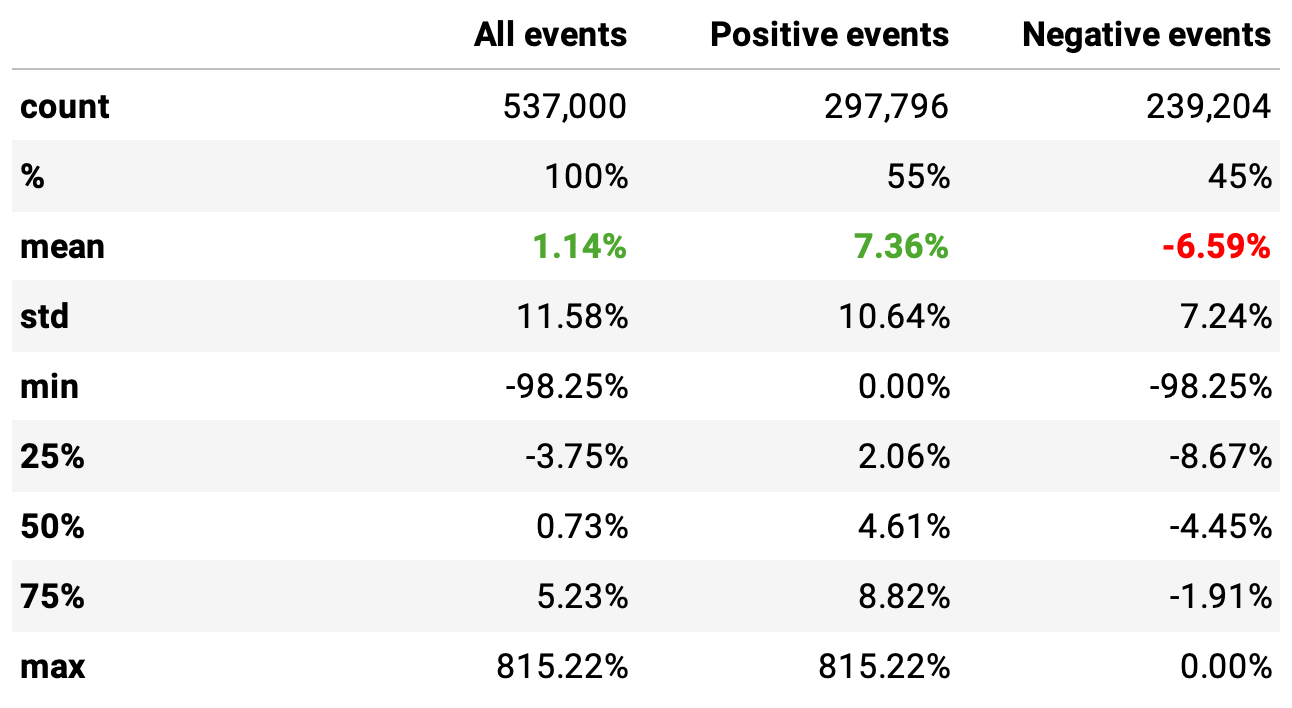
Since 2000, there have been a bit over half a million events of this nature in the dataset (I use the Nasdaq Sharadar Core US Equities Bundle dataset). From them:
On average, these events returned 1.14%;
55% were positive events, returning on average 7.36%;
45% were negative, return -6.59%;
The payoff ratio would be 7.36 / 6.59 = 1.1.
Now, let's look at the returns after 20 days of all all-time high events of IPOs:
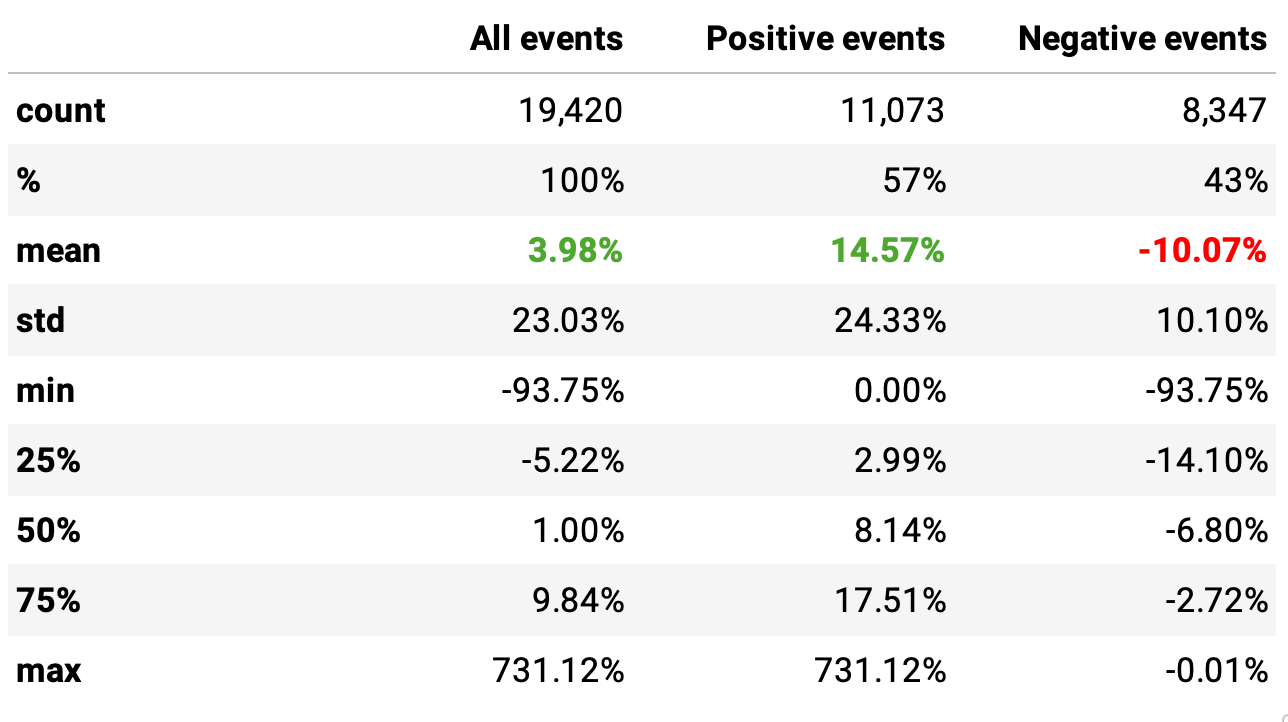
There are close to 20 thousand events in the dataset. From them, we can see the edge:
On average, the return after 20 days of IPOs all-time highs was 3.98%, 4x the return of non-IPOs;
57% were positive events (vs. 55% non-IPOs), returning 14.57%, 2x vs. non-IPOs;
43% were negative, returning -10.07% on average;
The payoff ratio would be 14.57 / 10.07 = 1.4 (vs. 1.1 non-IPOs).
The P-value is well below 0.05, which makes the difference between the means statistically significant.
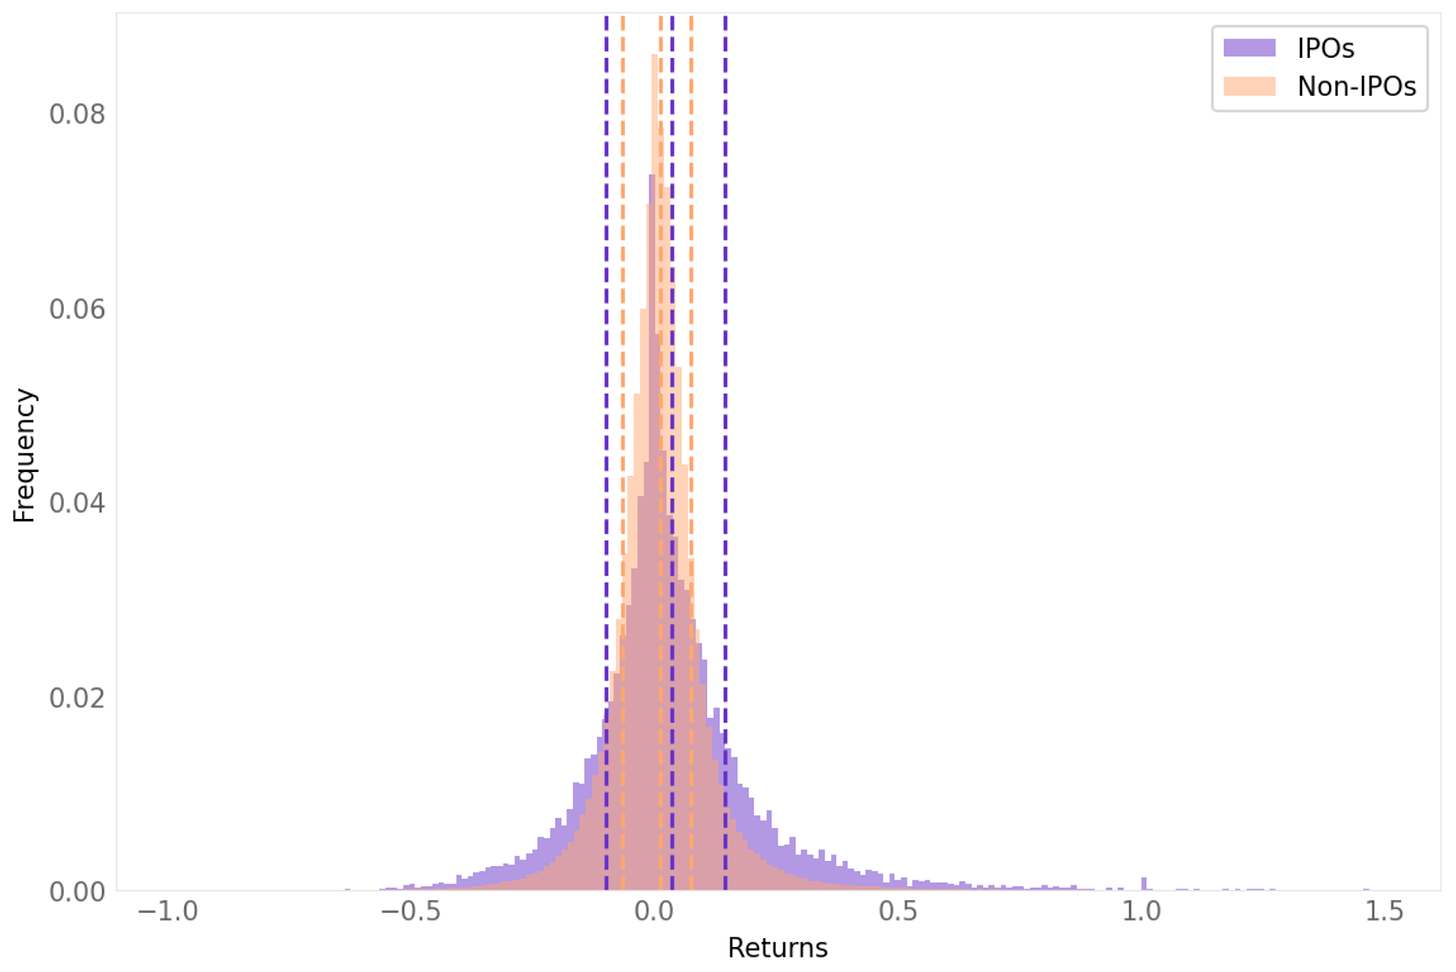
Let's look at the distribution of the returns:
In the chart above, the three dotted lines from each color are, from left to right, the average return of negative events, the average return total, and the average return of positive events.
There, we can clearly see the edge: the distribution of the events for IPOs has fatter tails, with a fatter right tail vs. its left tail.
Why does this edge exist?
There are several plausible hypotheses to explain why buying IPO stocks at all-time highs results in a higher expected return after a few days compared to buying other stocks at all-time highs:
Increased Investor Attention and Hype. IPO stocks often receive a lot of media attention and hype, especially if they are from well-known or highly anticipated companies. This increased attention can lead to higher demand and stronger short-term performance as more investors are drawn in.
Institutional Support and Lock-Up Periods. Institutional investors often play a significant role in the early trading of IPOs and may provide support to the stock price, particularly during the initial days of trading. Additionally, lock-up periods prevent insiders from selling their shares, reducing the potential for immediate selling pressure.
Market Sentiment and Momentum. Positive market sentiment and momentum can be stronger for new IPOs, especially if the company is perceived as innovative or disruptive in its industry.
Behavioral Biases. Investors may exhibit behavioral biases such as the "hot-hand fallacy" or "bandwagon effect," leading them to buy IPO stocks at all-time highs more aggressively than established stocks.
Short-Term Trading Strategies and Speculation. Short-term traders and speculators may be more active in IPO stocks, driving prices up in the short term as they seek quick profits.
We don't know for sure why. But we do know how to transform this anomaly into a profitable trading strategy.
The strategy
We already defined IPOs as companies recently listed with less than 90 days in history. However, to formulate a strategy, we need more definitions.
At the beginning of every day, we will buy the all-time high IPOs with the following rules:
We will split our capital into N slots (5, 10, 20, 30, 40) and buy all all-time highs: these are the maximum number of positions we will hold at any given time;
We never buy an IPO on its very first trading day; only from its 2nd trading day on, if it hits an all-time high;
If there are more IPOs at all-time highs than N, we will order them by market cap and prioritize the larger ones;
At the time we buy, we will set a profit target order with target P and a stop-loss order with limit L; the stop-loss will be trailing from the maximum price;
We will keep the positions until one of the two orders is triggered;
Once the slots are re-opened, we will fill them again with new IPOs at all-time highs.
Important: We will only trade mid-, large-, and mega-cap IPOs; we won't trade small-cap IPOs.
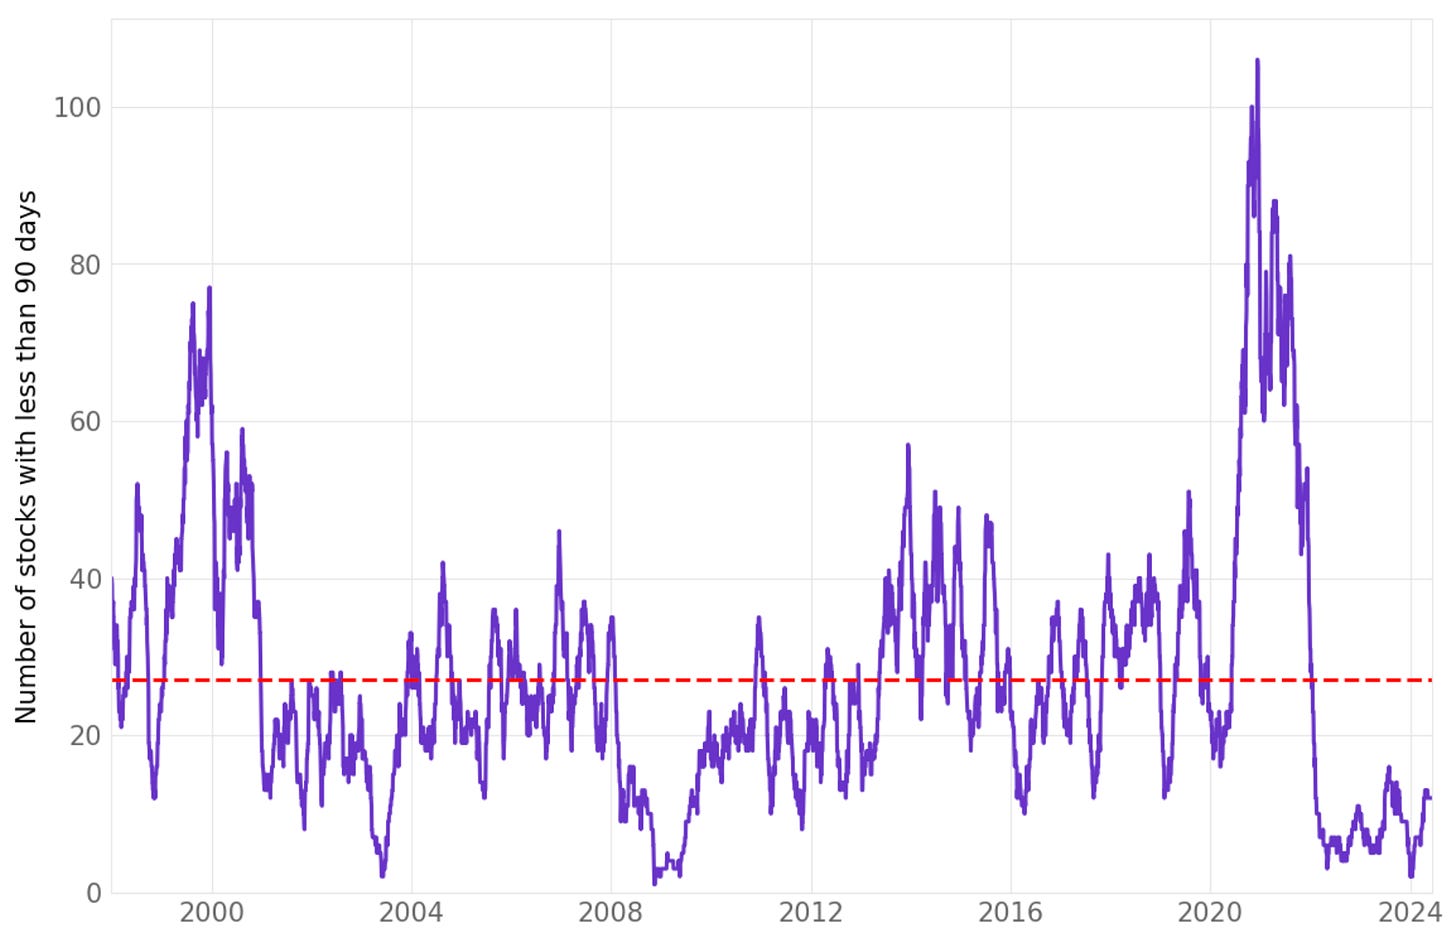
We've chosen these numbers for slots because, on average, there were 27 companies with less than 90 days in their history per day in our dataset:
Experiments
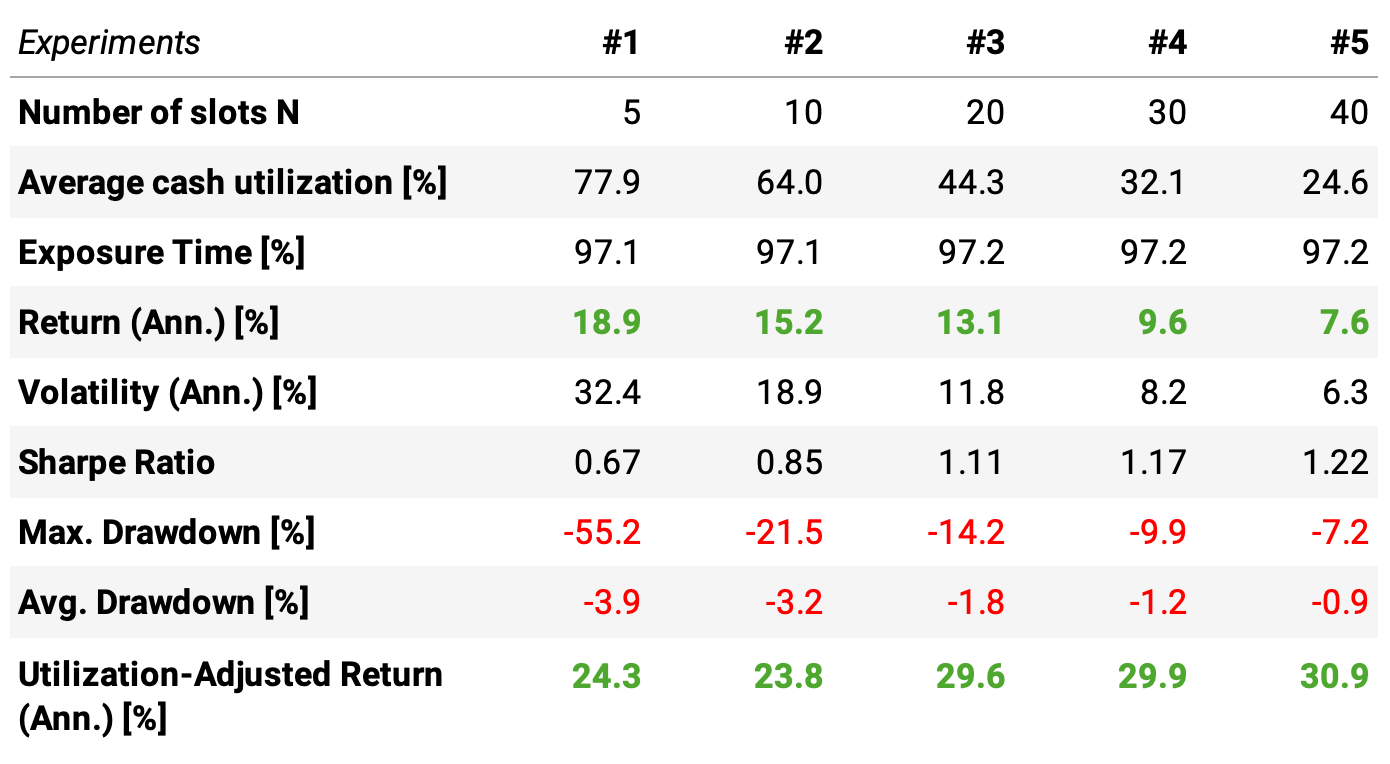
Let's start by exploring the impact of the number of slots on the strategy performance. We tried N = {5, 10, 20, 30, 40} as mentioned. For these experiments, we fixed the profit target at 10% and the stop loss at 5%. Here are the results:
The average cash utilization is the average of % capital deployed on any given day. As expected, as we increase the number of slots, the average cash utilization decreases. We saw in the previous chart that the average number of IPOs is 27: there are a few days where we could trade 40 IPOs.
Experiments 1 and 2 deliver higher returns, 18.9% and 15.2%, as they employ better the capital available. However, experiments 4 and 5 deliver higher risk-adjusted returns, 1.17 and 1.22 Sharpe, as they diversify better.
Here we see a conflict:
Reducing the number of slots improves the cash utilization, thus increasing the annual returns, but reduces the diversification, which increases the risk (lower Sharpe, higher drawdowns);
Increasing the number of slots increases the diversification, thus reducing risk (higher Sharpe, lower drawdowns), but reduces the cash utilization, which reduces the total return.
The utilization-adjusted return is the annual return divided by the average cash utilization. It indicates what kind of return we could expect if we achieved 100% cash utilization.
For N ≥ 20, the cash-utilization-adjusted return jumps from 24 to 30% and beyond. So, we will choose N = 20 to continue exploring the strategy.
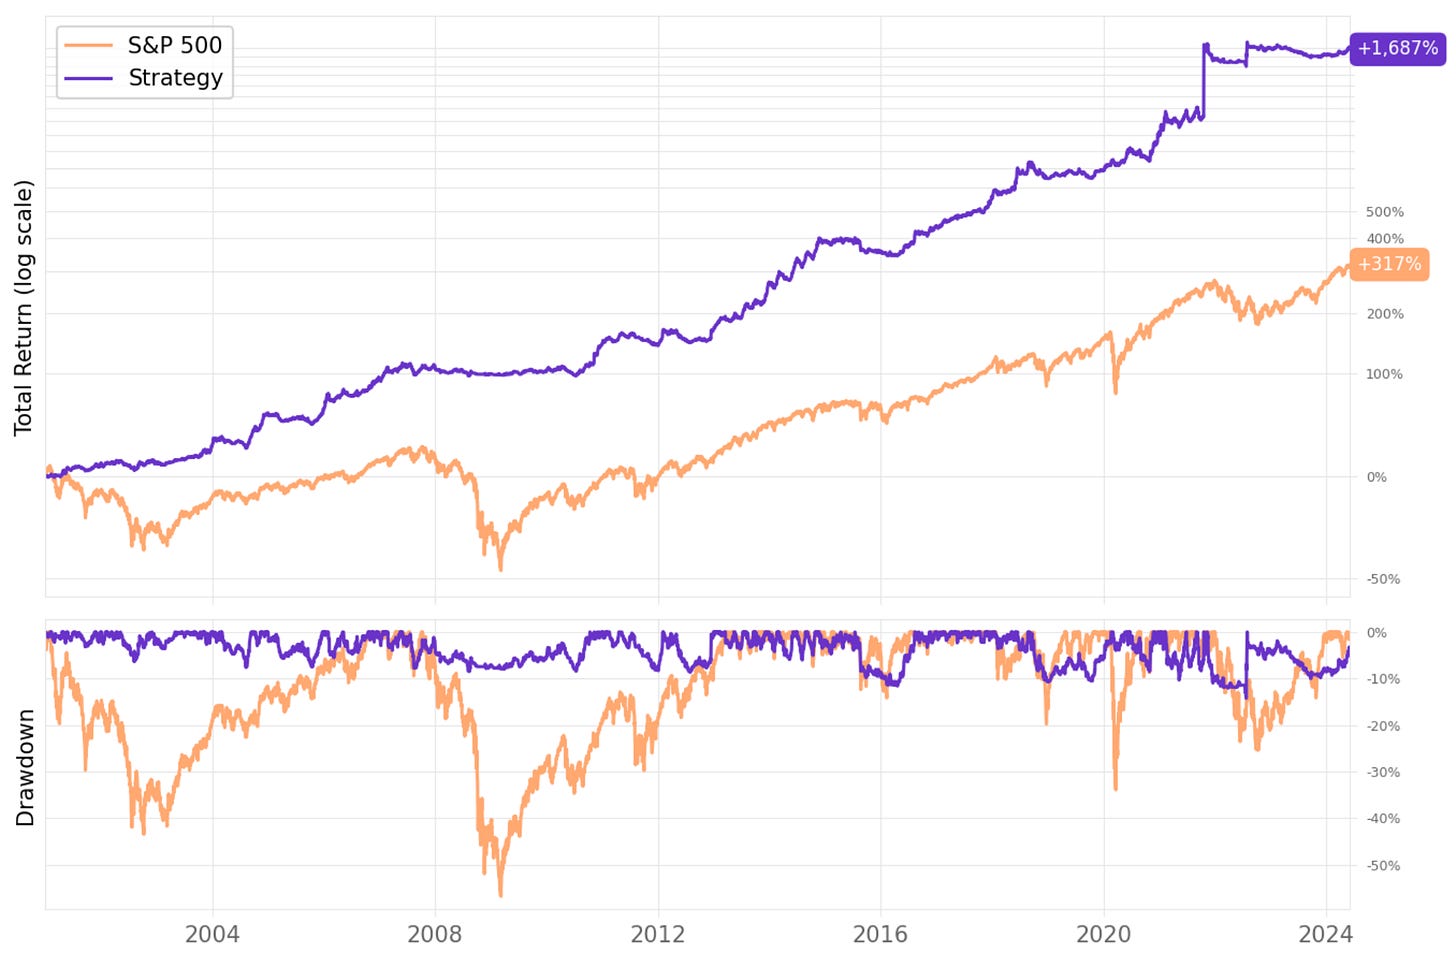
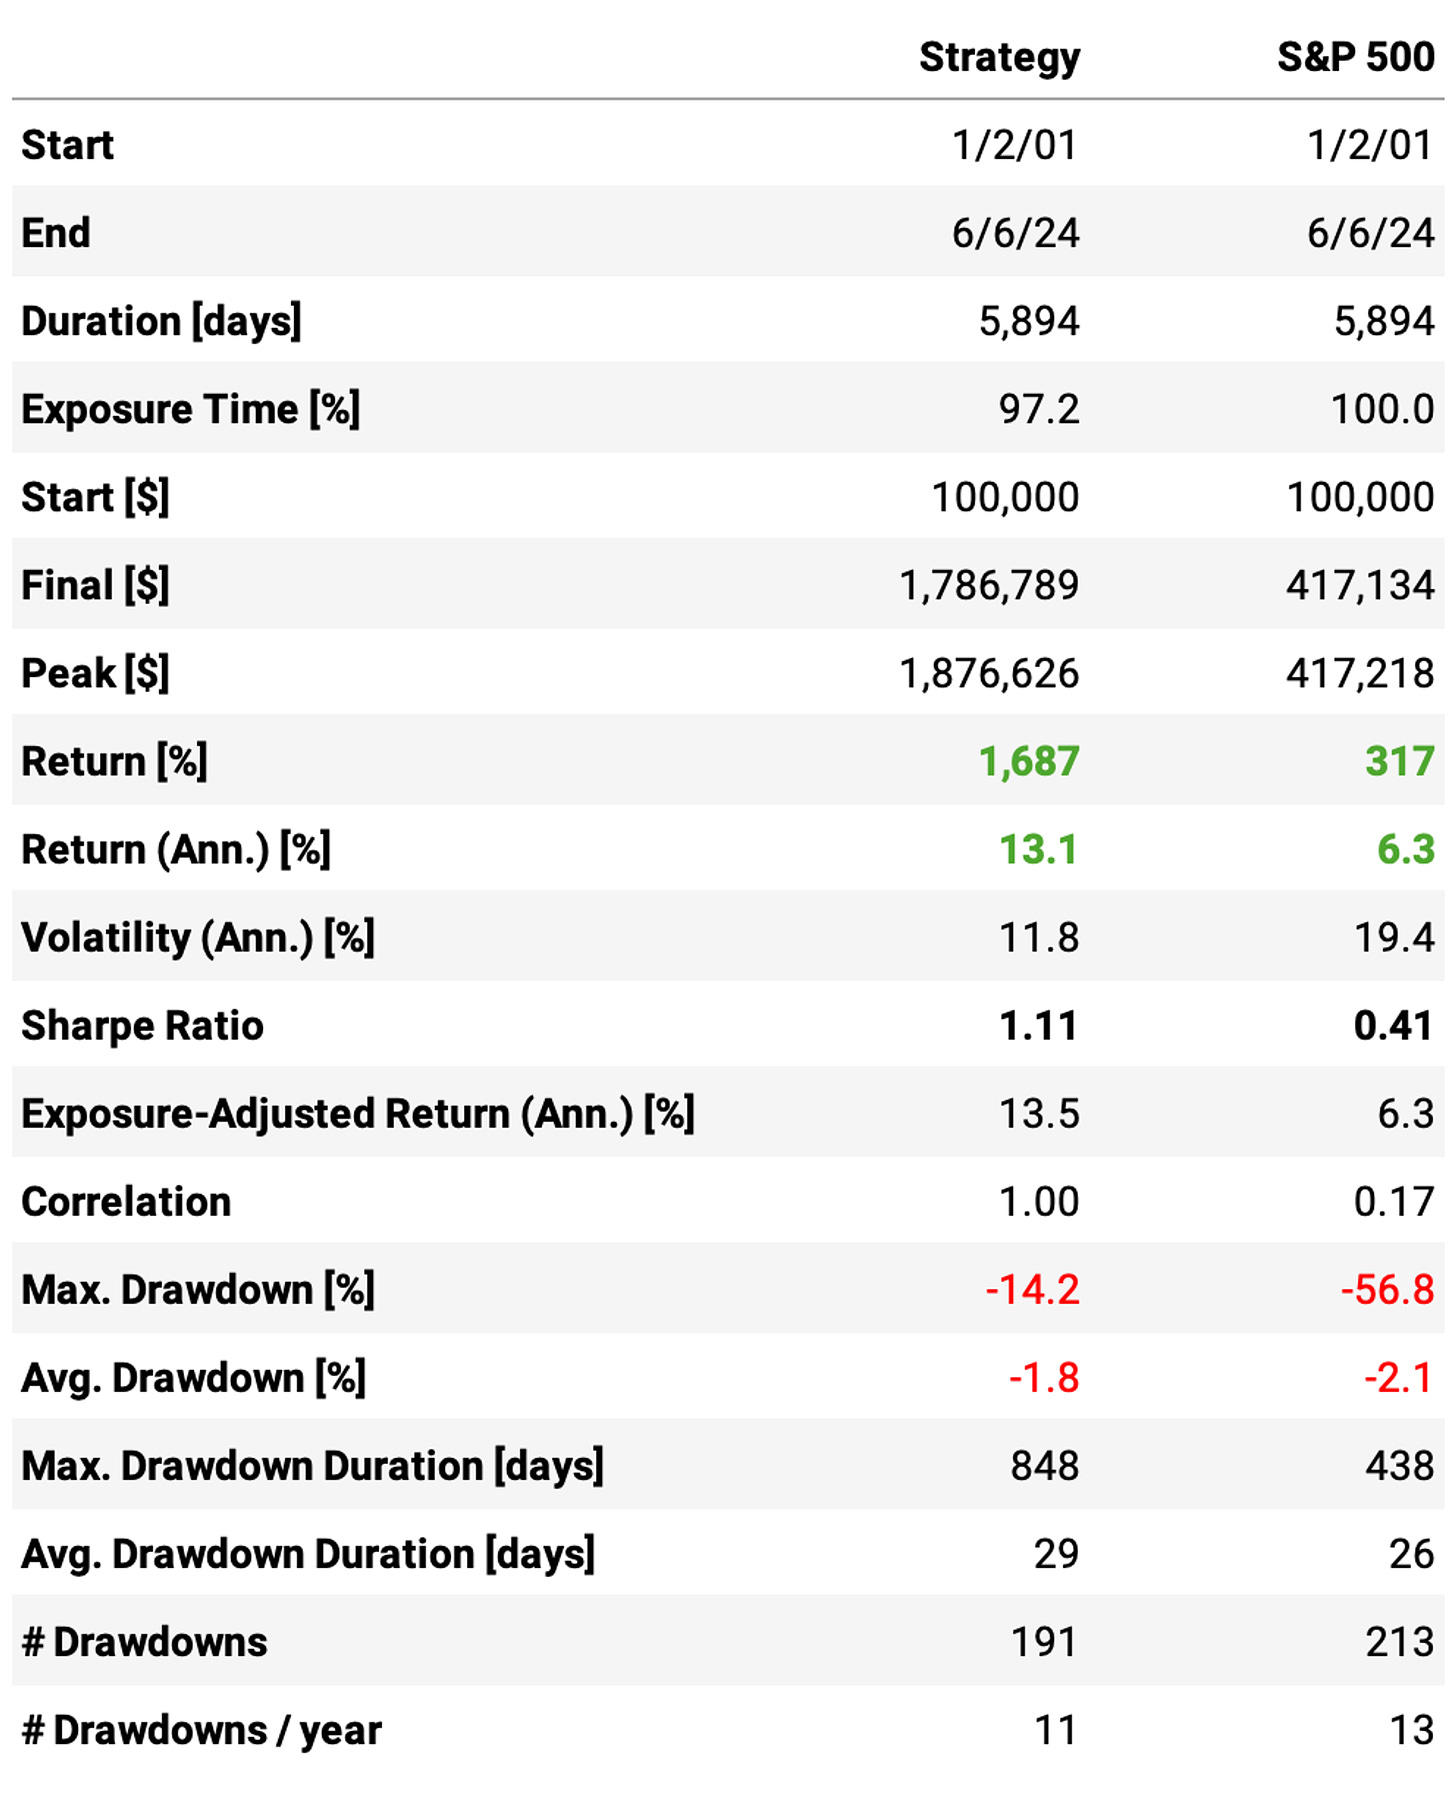
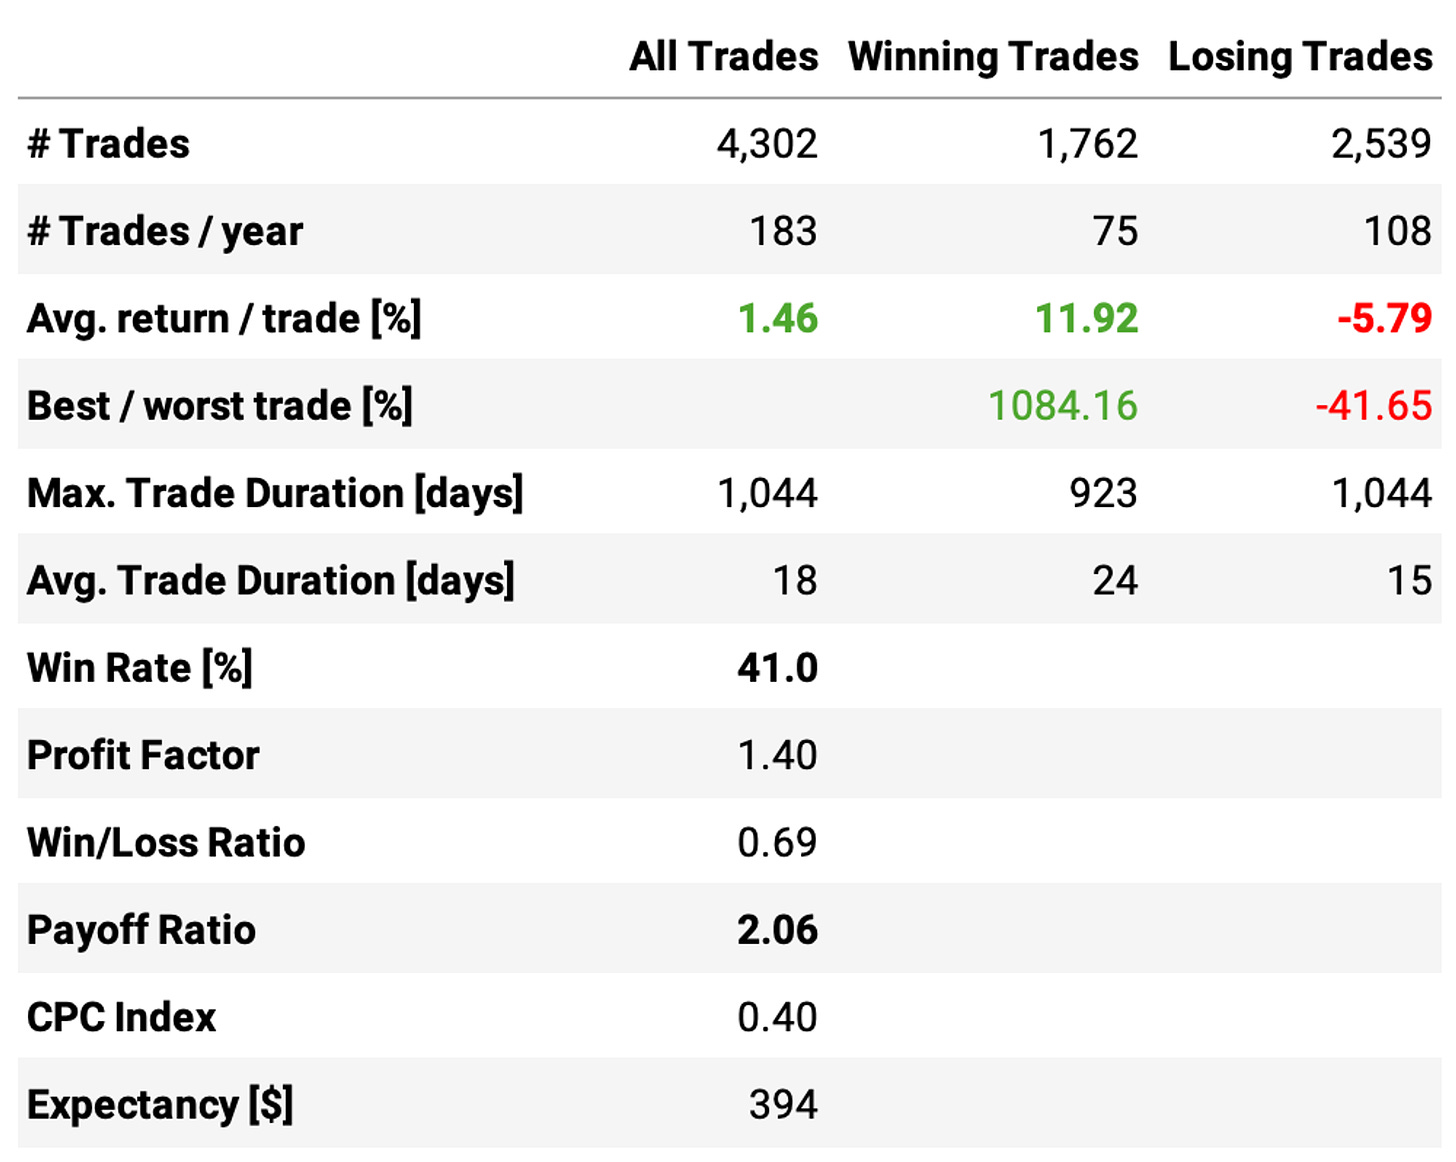
Here's the equity curve and the trade statistics for N = 20:
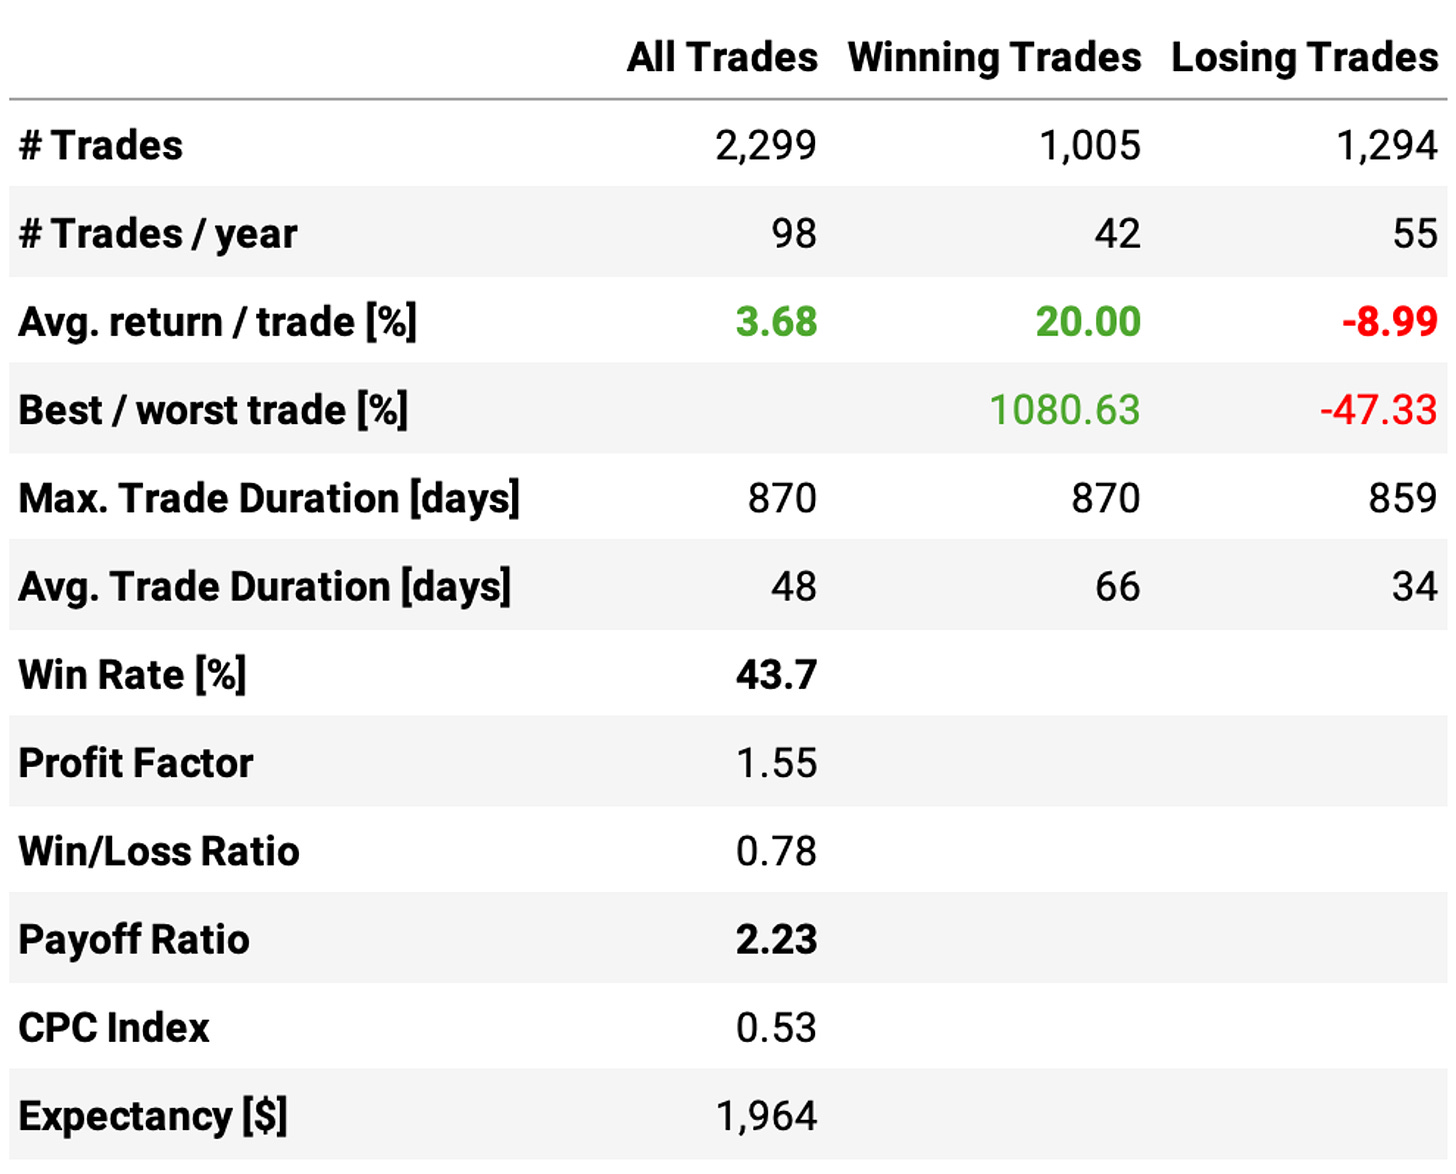
It's interesting to note that, although we have a win rate of only 41%, the strategy significantly outperforms the benchmark. That's because of a healthy payoff ratio of over 2: the average return per winning trade is 12%, while the average loss per losing trade is 6%.
Now, let's investigate the impact of the profit target P and the stop loss L in the strategy. We can definitely do better.
Improving the results with better profit targets and stop-loss orders
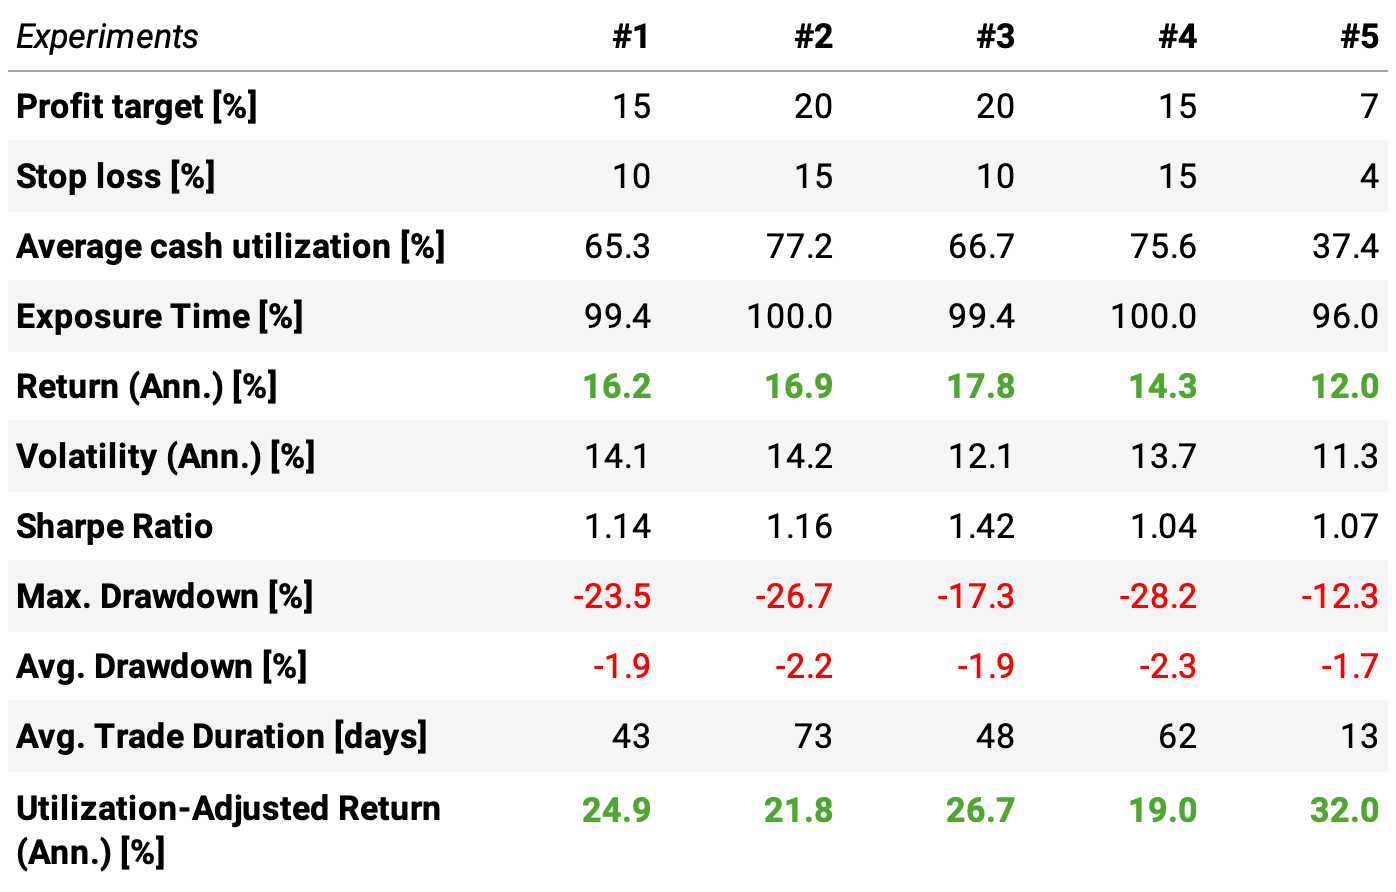
I suspected the profit target of 10% and the stop loss of 5% were too tight. IPOs tend to have a higher volatility than established stocks. So, I tested five different combinations of profit targets P and stop losses L. Here are the results:
We can draw several conclusions looking at this table and the baseline (N = 20, P = 10%, L = 5%):
Looking at experiment 5, the baseline, and experiment 1, we see how increasing the profit target and the stop loss is beneficial: the annual return goes from 12.0% (P/L = 7%/4%) to 13.1% (P/L = 10%/5%), to then 16.2% (P/L = 15%/10%);
Looking at experiments 1 and 4, we learn how having a favorable payoff is important: a 1:1 payoff of P/L (experiment 4) delivers only a 14.3% annual return, while a 3:2 payoff of P/L (experiment 1) delivers a 16.2% annual return;
Looking at experiments 2 and 3, we can observe how improving the payoff of P/L even further can boost the returns: going from 3:2 (experiment 2) to 2:1 (experiment 3) takes the annual return from 16.9% to 17.8%;
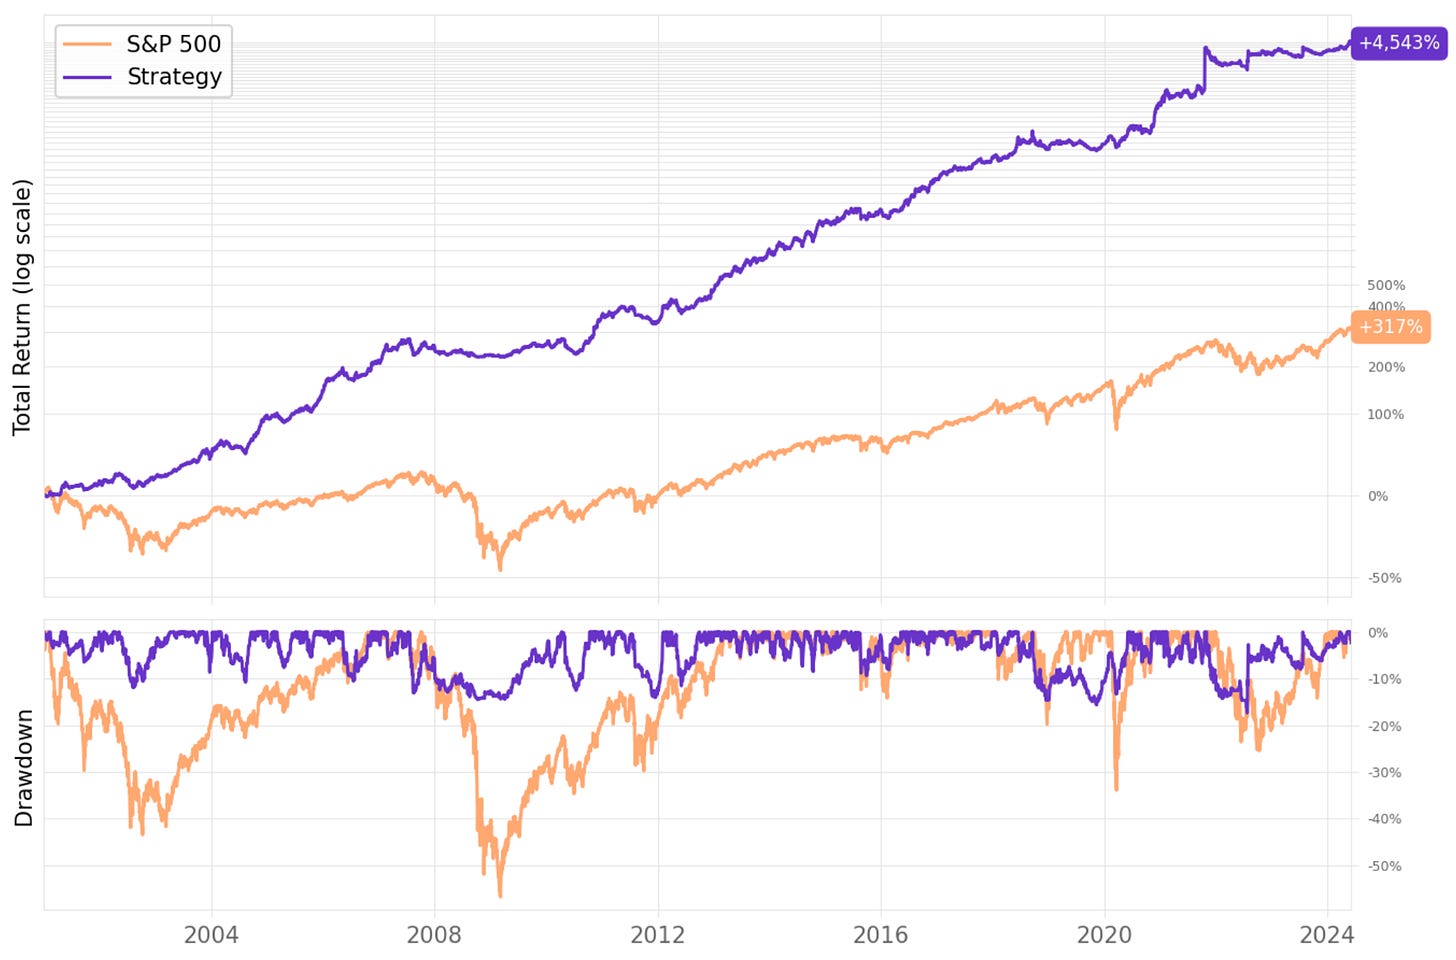
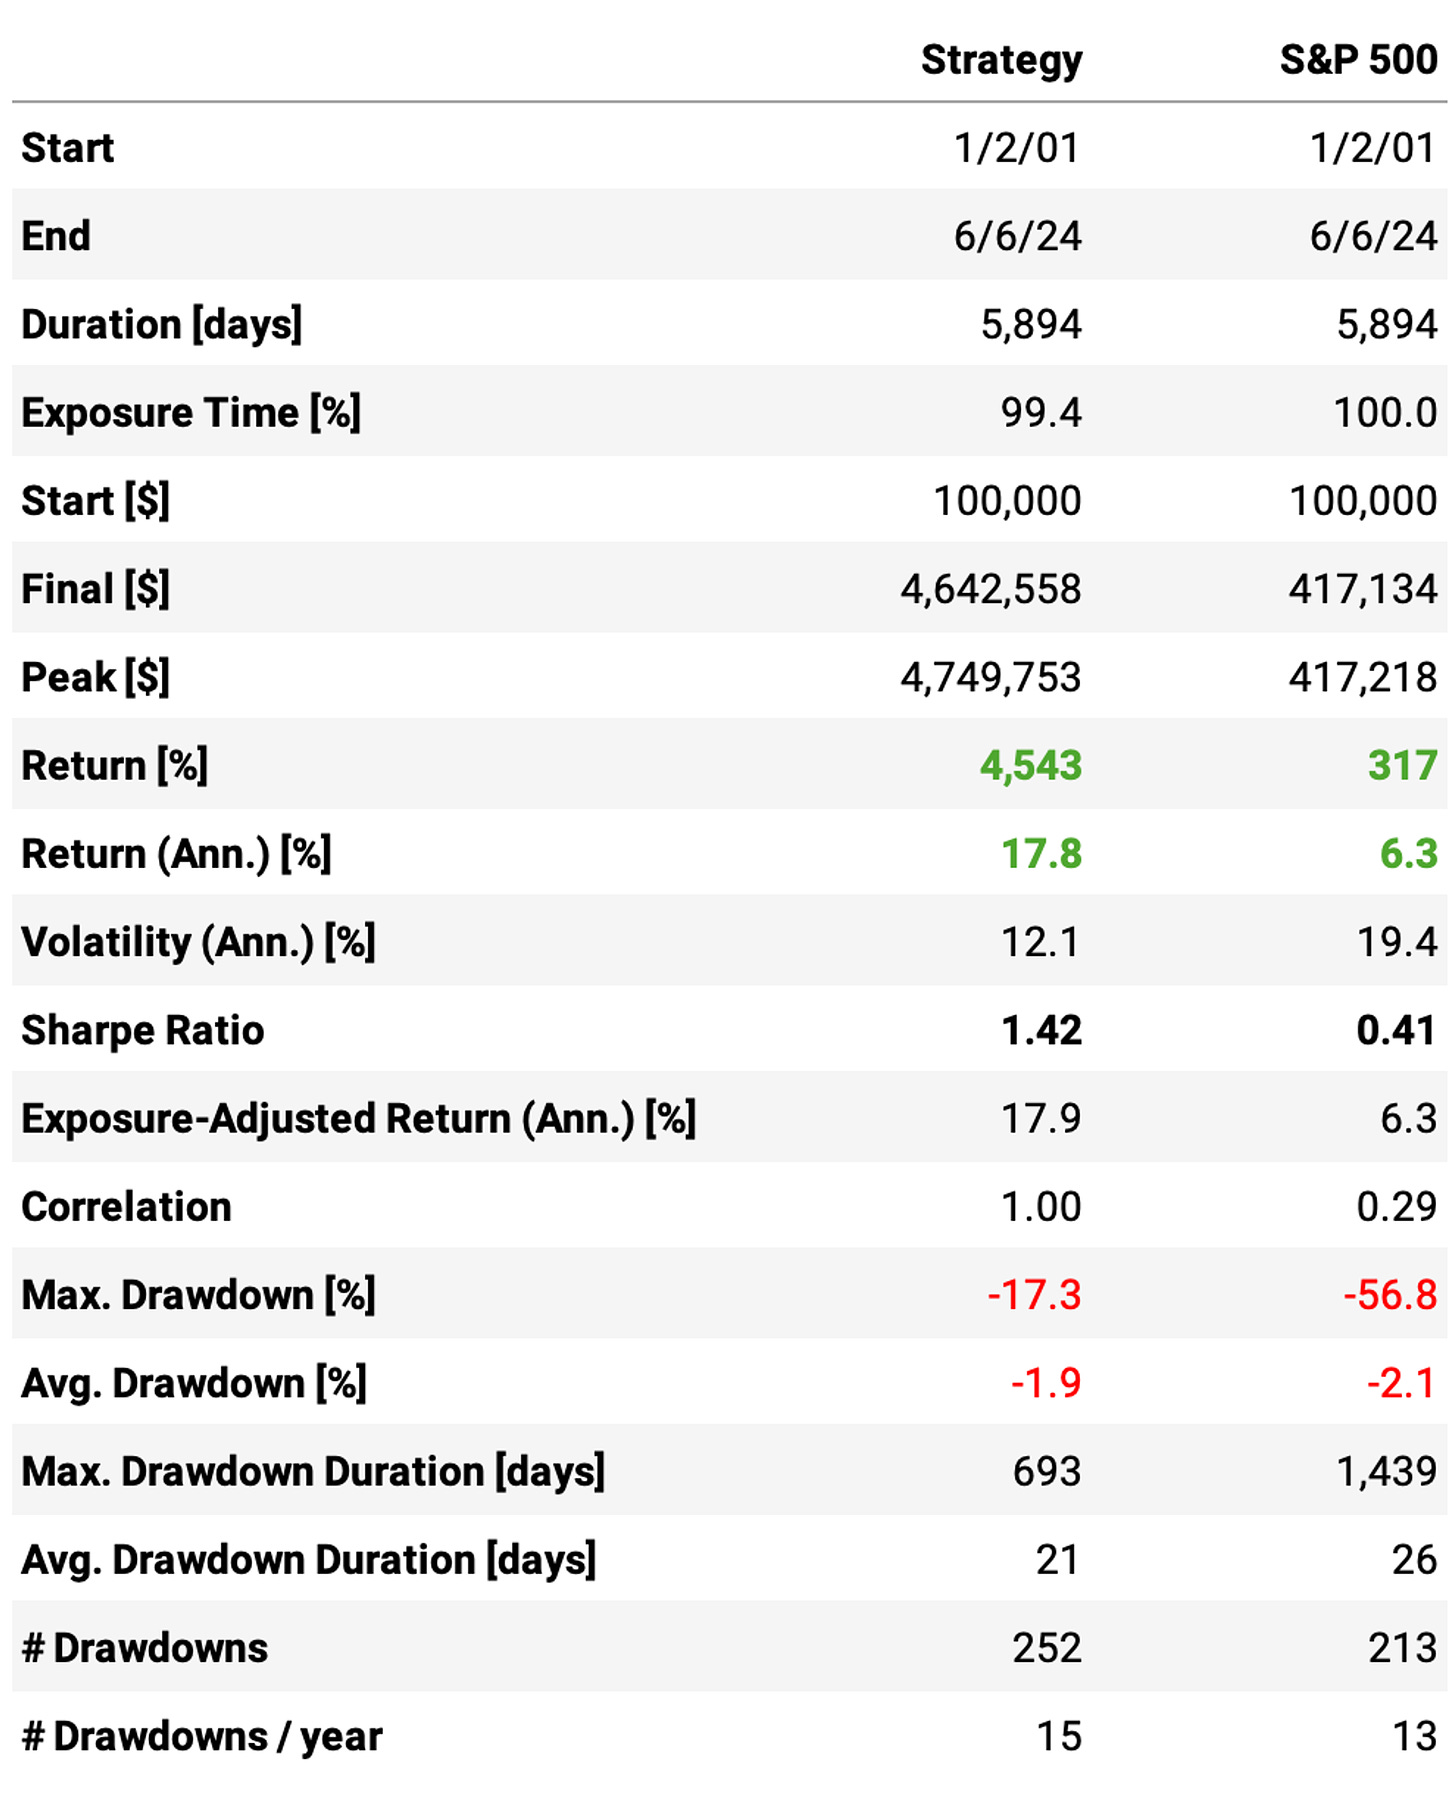
The profit target of 20% and stop loss of 10%, with 20 slots (experiment 3), is the best experiment with 17.8% annual returns, a 1.42 Sharpe, and a 17.3% max. drawdown. Here are the equity curve and all its stats:
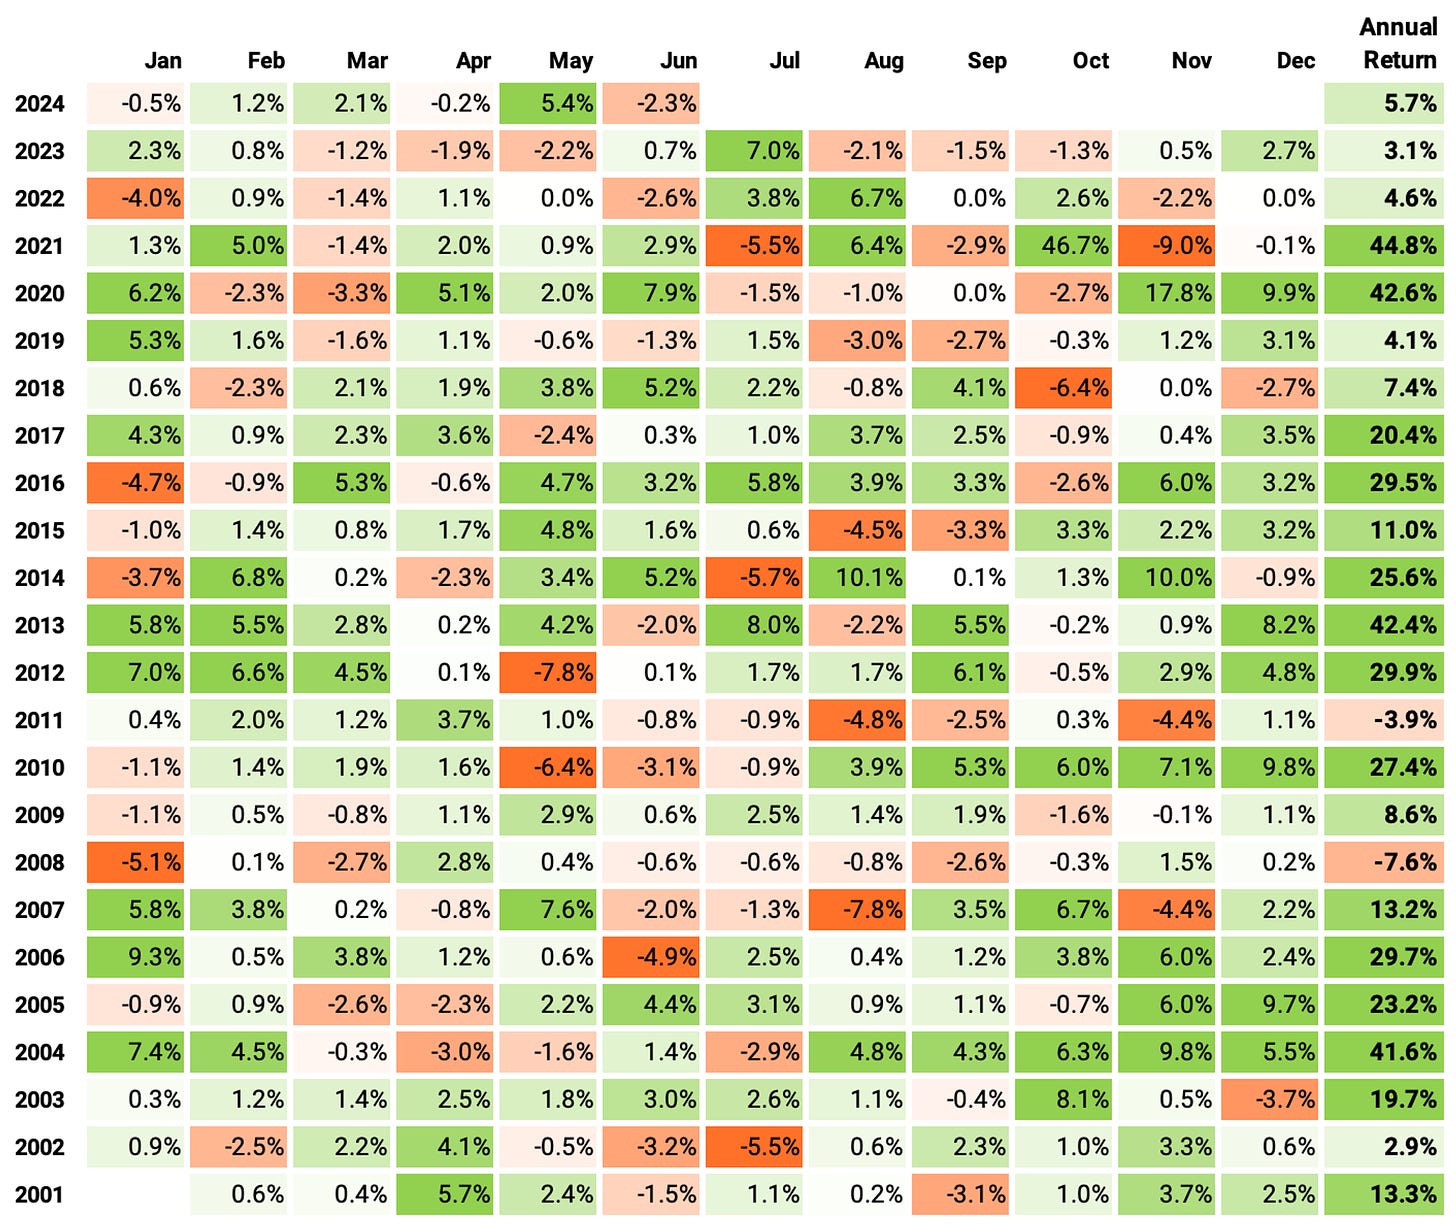
Let's look at the monthly returns of this strategy:
If we had traded this strategy in the last 23 years:
We would have had only 2 down years (2008 and 2011);
We would have seen 66% of the months positive, with the best at +46.7% (Oct '21: this above-average return was driven by DJT, which the strategy bought 8 days after its IPO and held for 37 days);
We would have seen 34% of the months negative, with the worst at -9.0% (Nov' 21);
The longest positive streak would have been 13 months, from Aug '02 to Aug '03;
The longest negative streak would have been for 5 months, from Jun '08 to Sep '08.
Final thoughts
I like this strategy. It's simple. It has a clear edge we can understand. It has a built-in market regime filter, as Marsten explained in the interview I listened to: whenever we are in a bear market, the number of IPOs goes down, which makes the strategy deploy less capital. I'd trade this strategy as is.
However, something still bothers me: capital utilization. The strategy as is would have delivered a nice 17.8% annual return over the past 23 years, but it would have utilized, on average, only 66.7% of the capital. On any given day, 1/3 of the capital would have been sat in cash, unemployed. If we had managed to employ all the capital available, the annual return would have been close to 27%.
So, to better utilize 100% of the cash available, we need to tweak the strategy. Maybe employing a dynamic number of slots instead of a fixed number would work. For example, use the 90-day moving average of the number of stocks listed within the past 90 days as the number of slots. But that's an idea for a future post.
I'd love to hear your thoughts about this approach. If you have any questions or comments, just reach out via Twitter or email.
Also, if you want to implement this strategy and need help, just let me know.
Cheers!





have you tried a long/short market neutral version of this? how about shorting just spx?
Do you buy 1 tick higher than the all time high or a close above all time high? Same with stop loss / profit target -close above/below?