
Tech stocks and Treasury yields Spread
Trading the spread to a +22.1% annual return and 1.32 Sharpe
The idea
"Most of a tech company's value will come at least 10 to 15 years in the future." Peter Thiel
In his famous book Zero to One, Peter Thiel discusses the valuation of technology companies. "In March 2001, PayPal had yet to make a profit, but our revenues were growing 100% year over year. When I projected our future cash flows, I found that 75% of the company's present value would come from profits generated in 2011 and beyond. And even that turned out to be an underestimation."
Interest rates, influenced by Treasury bond yields, are crucial in determining the discount rates used in valuing stocks. When Treasury yields rise, the discount rate for future cash flows also rises, reducing the present value of these cash flows. Tech stocks, which often have high growth expectations and cash flows projected far into the future, are particularly sensitive to changes in discount rates.
This is the premise of today's idea. The original rules are:
Signal:
We compute a spread between QQQ (which tracks the Nasdaq-100 Index) and TLT (which tracks the performance of long-term U.S. Treasury bonds) as the ratio between both prices;
We then compute the 3-day RSI of the spread to track overbought and oversold signals;
Entry rules:
When the 3-day RSI of the spread is below 15, we go long on QQQ;
When the 3-day RSI of the spread is above 85, we go long on TLT;
Exit rules:
When the 3-day RSI of the spread is above 70, we close QQQ trade;
When the 3-day RSI of the spread is below 30, we close TLT trade.
First experiments
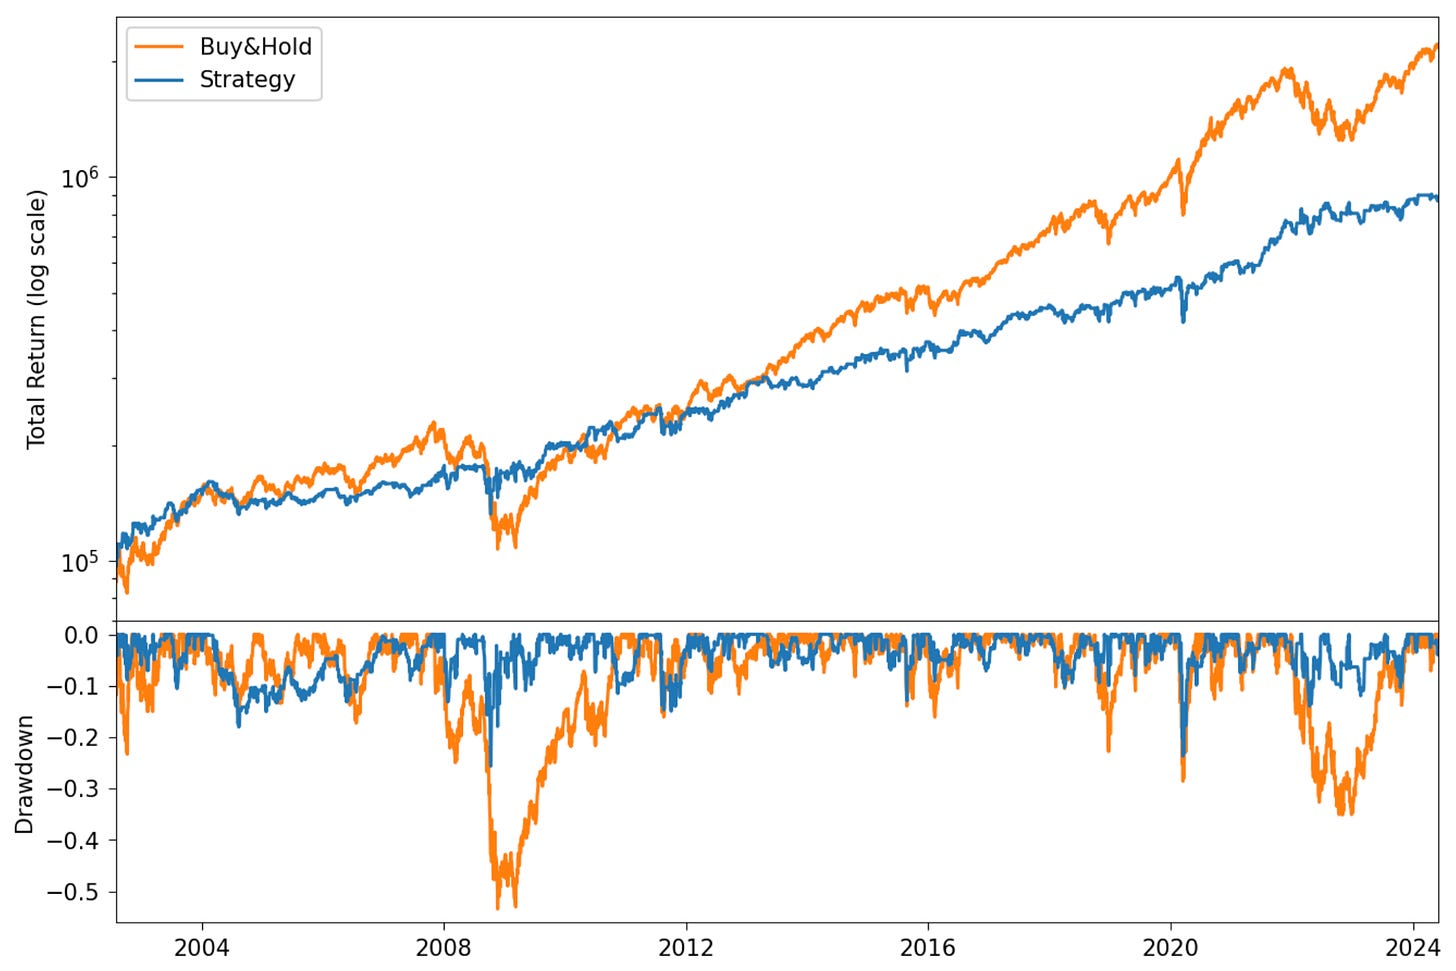
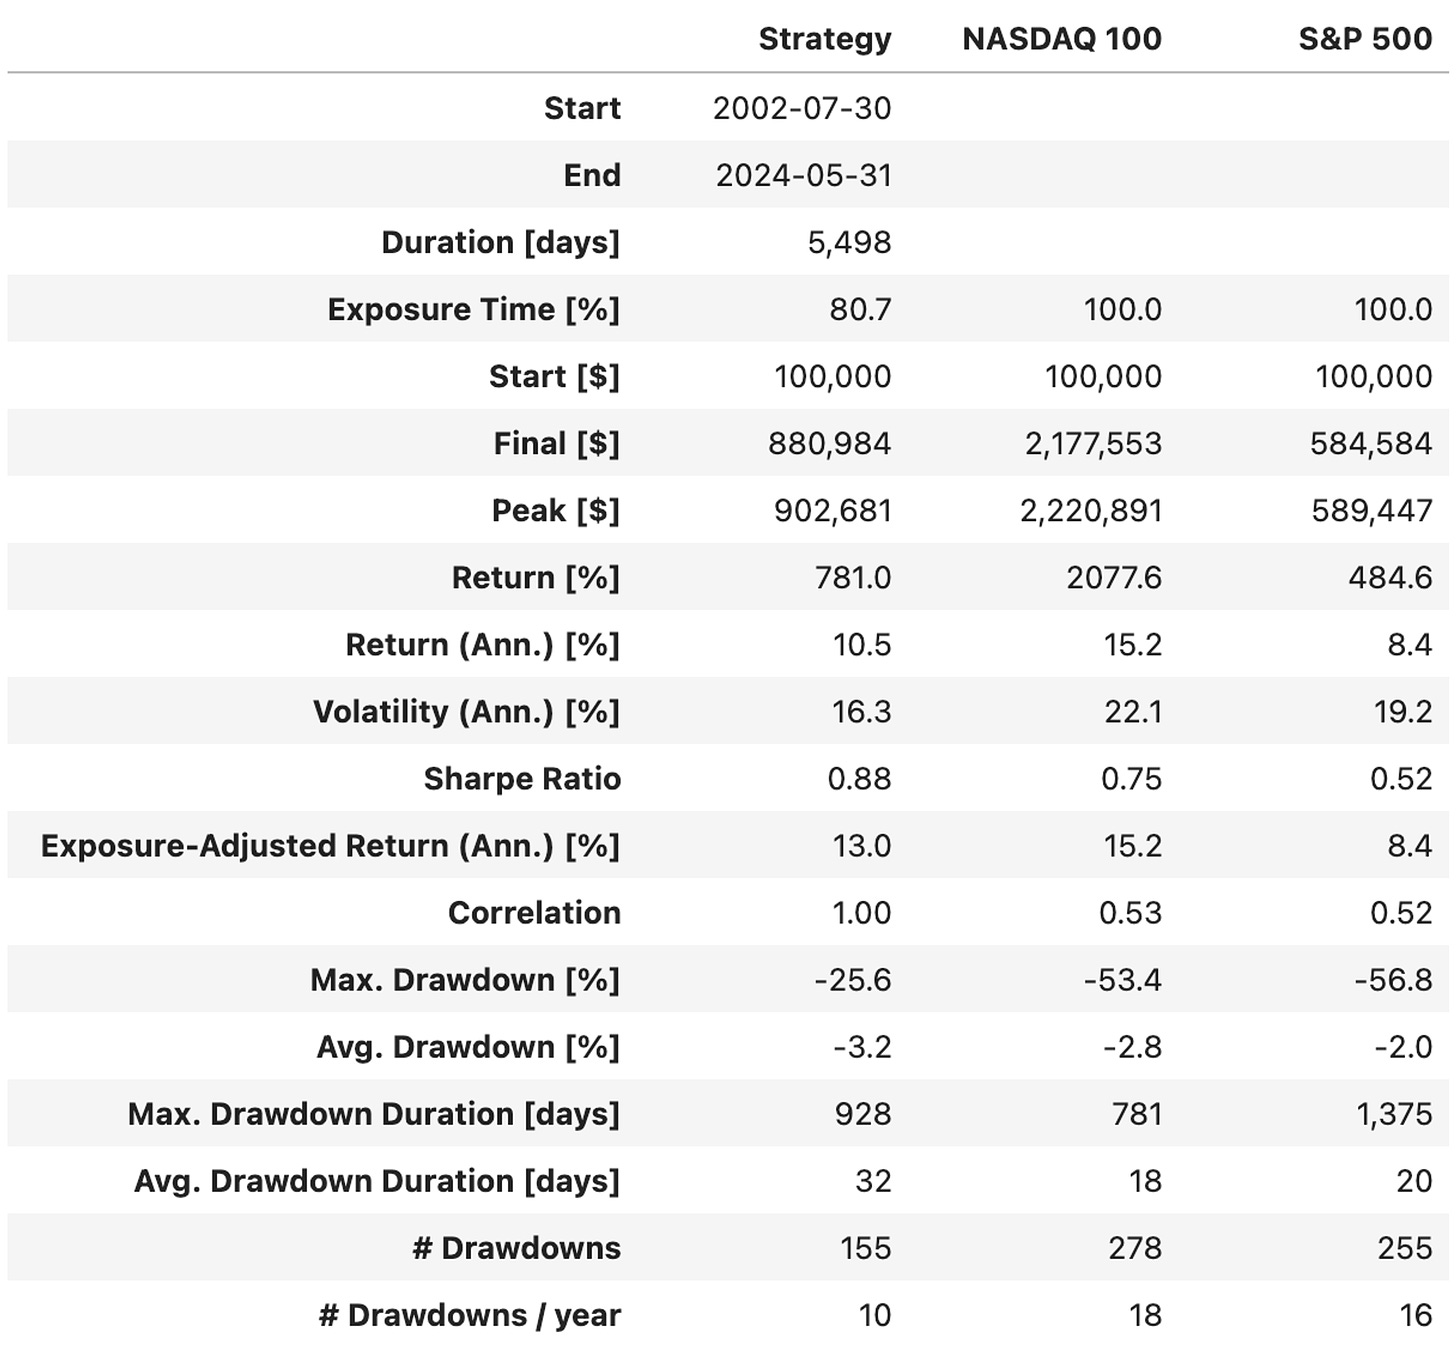
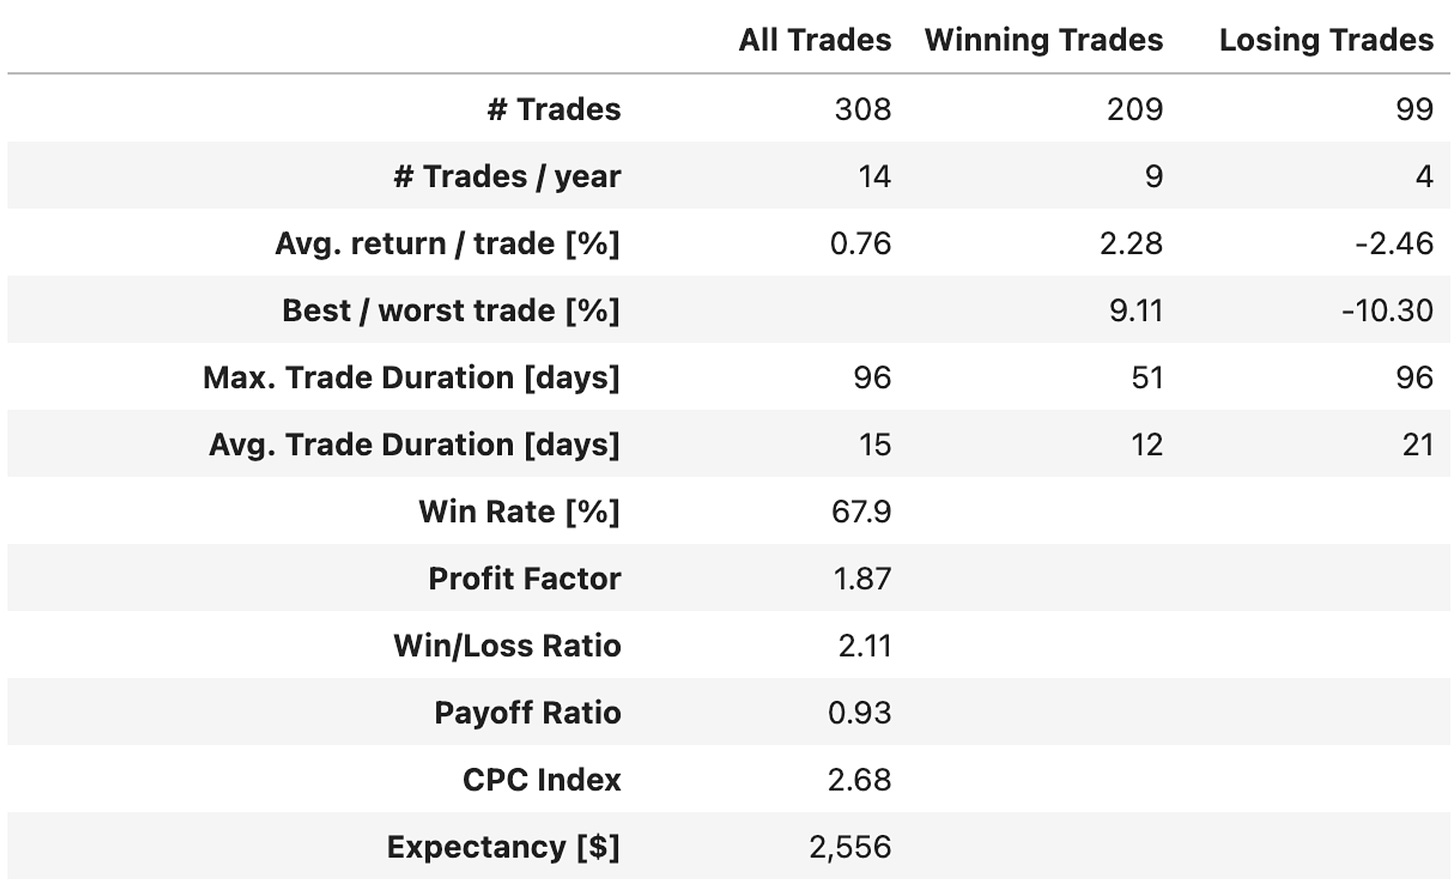
Running the strategy with the original rules, I got a 10.5% annual return vs. 15.2% Buy&Hold, with a 0.88 Sharpe. The equity curve is smoother, with fewer and shorter drawdowns:
Can we do better?
Using leverage
The first idea to improve the strategy is to use leverage. We use 2x leverage:
QLD instead of QQQ;
UBT instead of TLT.
We also tightened the entry and exit rules:
Entry thresholds of 10 and 90 instead of 15 and 85;
Exit thresholds of 60 and 40 instead of 70 and 30.
(To prevent the risk of overfitting, we are forward-testing all strategies before going live.)
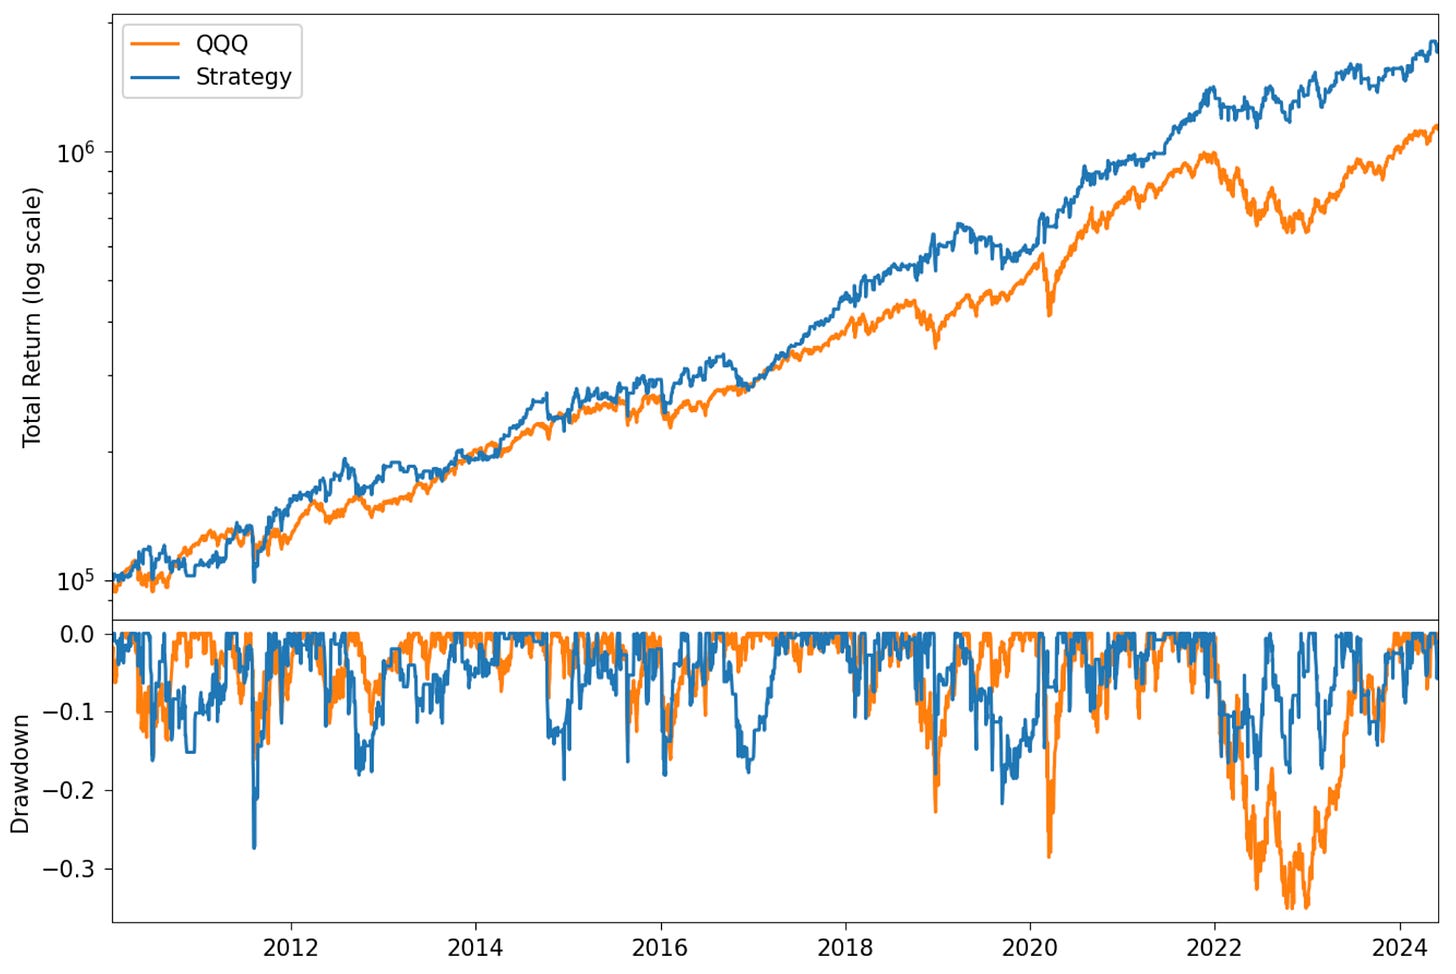
The adjustments resulted in the following:
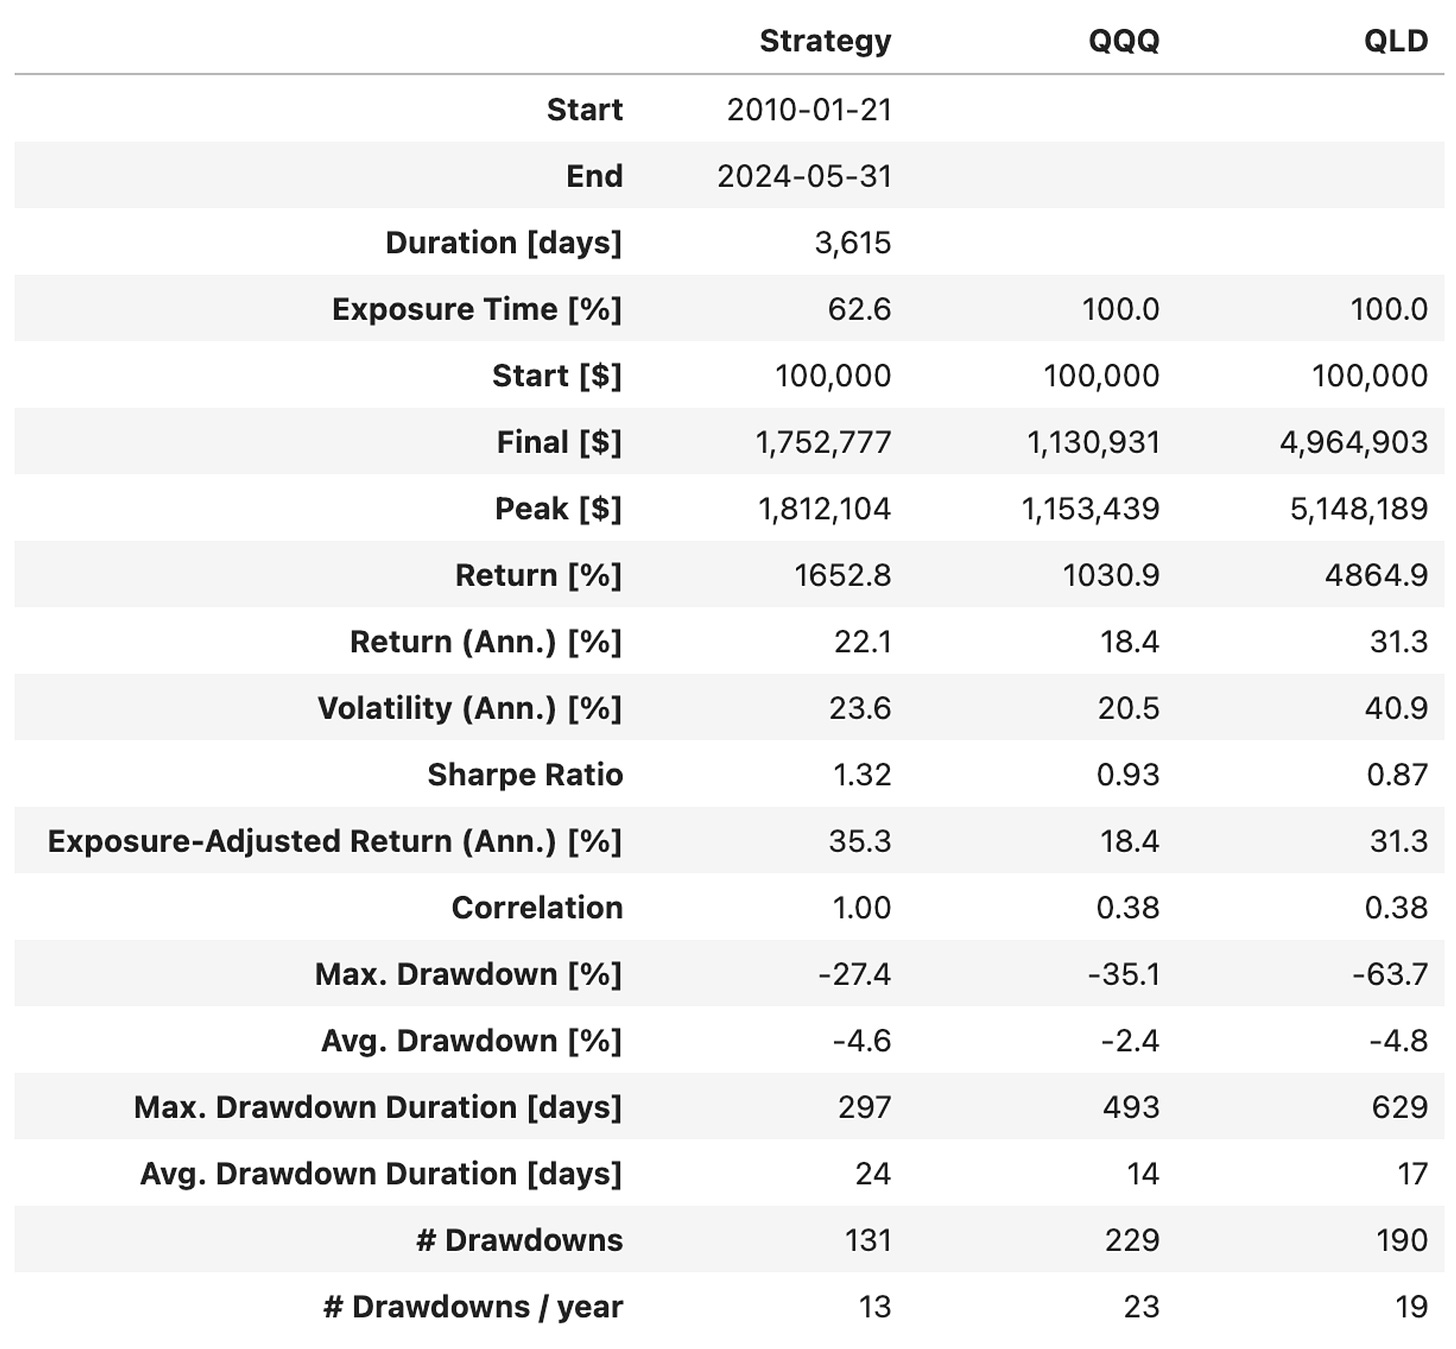
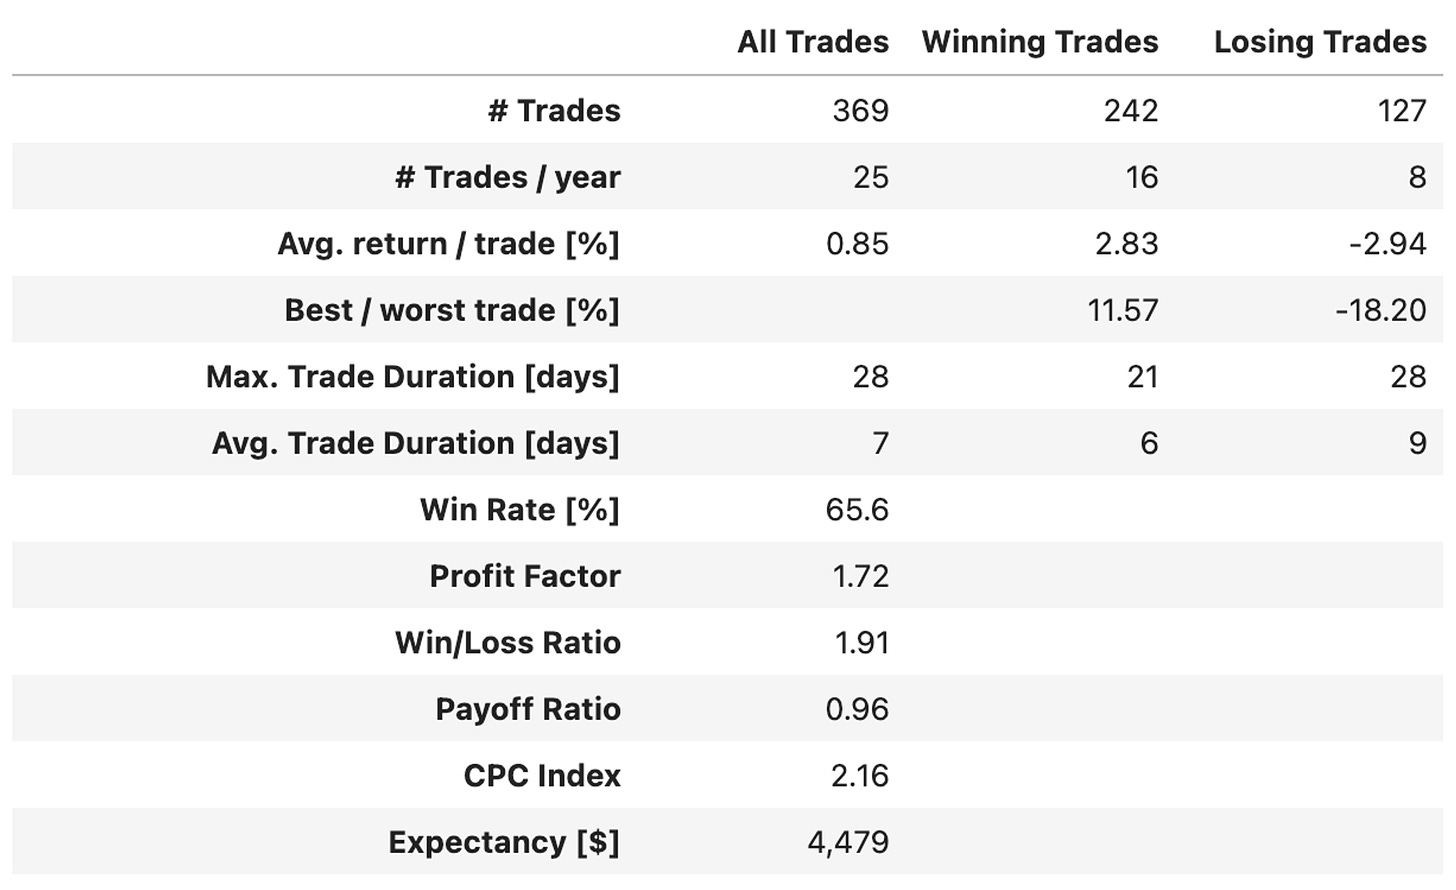
These are better results:
The annual return increased to 22.1% in comparison to 18.4% QQQ in the same period;
This annual return was lower than the QLD's (31.3%); however, the strategy was invested only 63% of the time. If it were invested the whole period, the return would have been 35.3% (the exposure-adjusted return);
The strategy delivered a lower maximum drawdown (27%) in comparison to both QQQ and QLD;
Although the average drawdown was worse (4.6% vs. 2.4% QQQ) and longer (24 days vs. 14 days QQQ), the strategy had almost half of the drawdowns (13/year vs. 23/year QQQ).
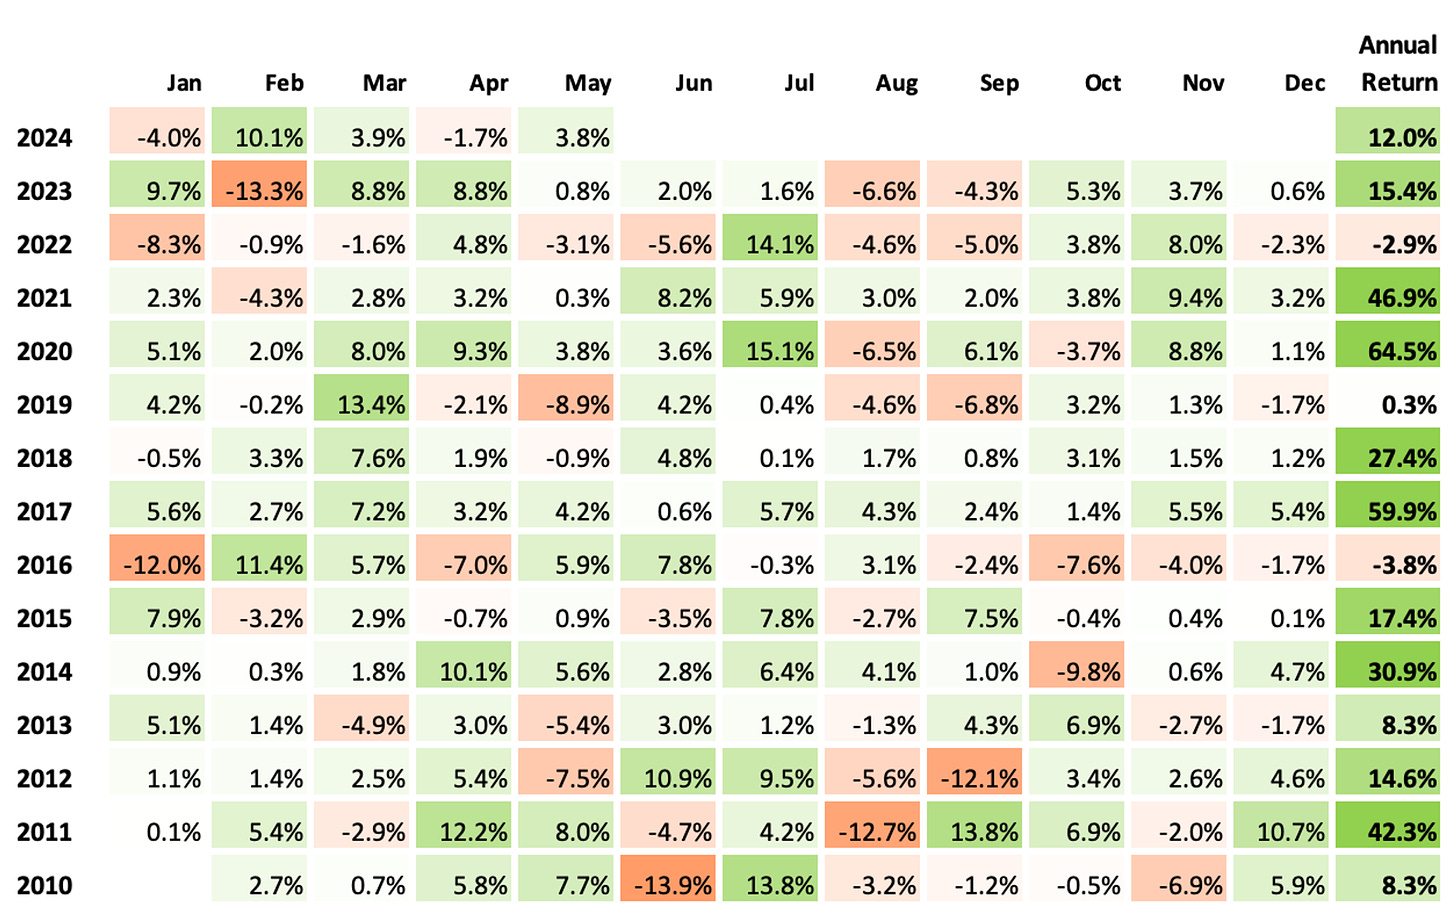
Let's look at the monthly and annual returns since 2010:
If we had traded this strategy in the last 15 years:
We would have had only two down years (2022 and 2016);
We would have seen 69% of the months positive, with the best at +15.1% (Jul' 20);
We would have seen 31% of the months negative, with the worst at -13.9% (Jun' 10);
The longest positive streak would have been 12 months, from Jan '17 to Dec '17;
The longest negative streak would have been 4 months, from Sep '16 to Dec '16.
Final thoughts
Although these numbers are tempting, and I'm forward-testing this strategy, I'm not trading it, and I don't think I will, even after looking at the forward-test results. The drawdowns are too large and too long for my taste.
However, the one thing that really caught my eye wasn't any specific number or metric; it was the idea's logic. I genuinely believe the reasoning is sound. Before implementing this strategy, the first number I looked at was the correlation between QQQ and TLT daily returns. As expected, I saw a negative number (-0.28), which increases as we look into the distribution's tails (-0.44 beyond two sigmas).
Maybe the RSI of the spread between QQQ and TLT, computed as the ratio between their prices, is not the best instrument to trade this relationship. Maybe there is a more profitable way to exploit the impact of interest rates on tech stocks' short-term price movements. We will keep looking.
I'd love to hear your thoughts about this approach. If you have any questions or comments, just reach out via Twitter or email.
Also, if you want to implement this strategy and need help, just let me know.
Cheers!
Quantitativo




What about Bollinger Bands instead of an RSI?
Perhaps the expectation of future rate changes impacts tech stock prices more than spot rates alone? If so, then somehow integrating the spread between spot long term treasuries (or spot ZQ ~ fed funds) and a related futures price could lead to interesting results.