Squeezing more profits with cumulative RSI
Can we beat the 30% annual return obtained using vanilla RSI?

"On a given day, a given circumstance, you think you have a limit. And you then go for this limit and you touch this limit, and you think, 'Okay, this is the limit'. And so you touch this limit, something happens and you suddenly can go a little bit further.” Ayrton Senna.
The idea
Is it possible to squeeze more profits from the Holy Grail of indicators? Let's find out.
As mentioned in the last article, Larry Connors considers the 2-period RSI the Holy Grail of indicators. Since he published this idea in 2008, we saw that the vanilla strategy lost most of its power.
However, we managed to create a new version of his strategy by learning that the lower the market cap, the higher the edge in the mean-reversion signal, and by trading multiple instruments in parallel instead of only one. This new version achieved a 30.3% annual return since 1999, with a 35% max drawdown (not great, but much better than the 57% of the benchmark).
After Connors demonstrated the 2-period RSI, he introduced the concept of Cumulative RSIs: by adding up the past number of days of 2-period RSI readings, you get its cumulative reading.
“When we first looked at this concept, we were pleasantly surprised by the results. As we went deeper, we saw the results to be even more robust than we first imagined. We saw positive, healthy returns in U.S. indices, in ETFs, on world indices, in individual U.S. stocks, and in international stocks going back more than a decade.” Larry Connors, about the Cumulative RSI.
So, let's see where his Cumulative RSI strategy might take us. The original rules, as described in his "Short Term Trading Strategies That Work" book:
The security being used is above its 200-day moving average.
Use a 2-period RSI;
Take the past X days of the 2-period RSI and add them up;
Buy if the Cumulative RSI is below Y;
Exit when the 2-period RSI closes above 65.
The edge of cumulative RSIs vs. vanilla RSI
As usual, before diving into strategy formulation and backtests, let's investigate the edge cumulative RSIs might have over the vanilla RSI.
First, let's check the vanilla RSI:
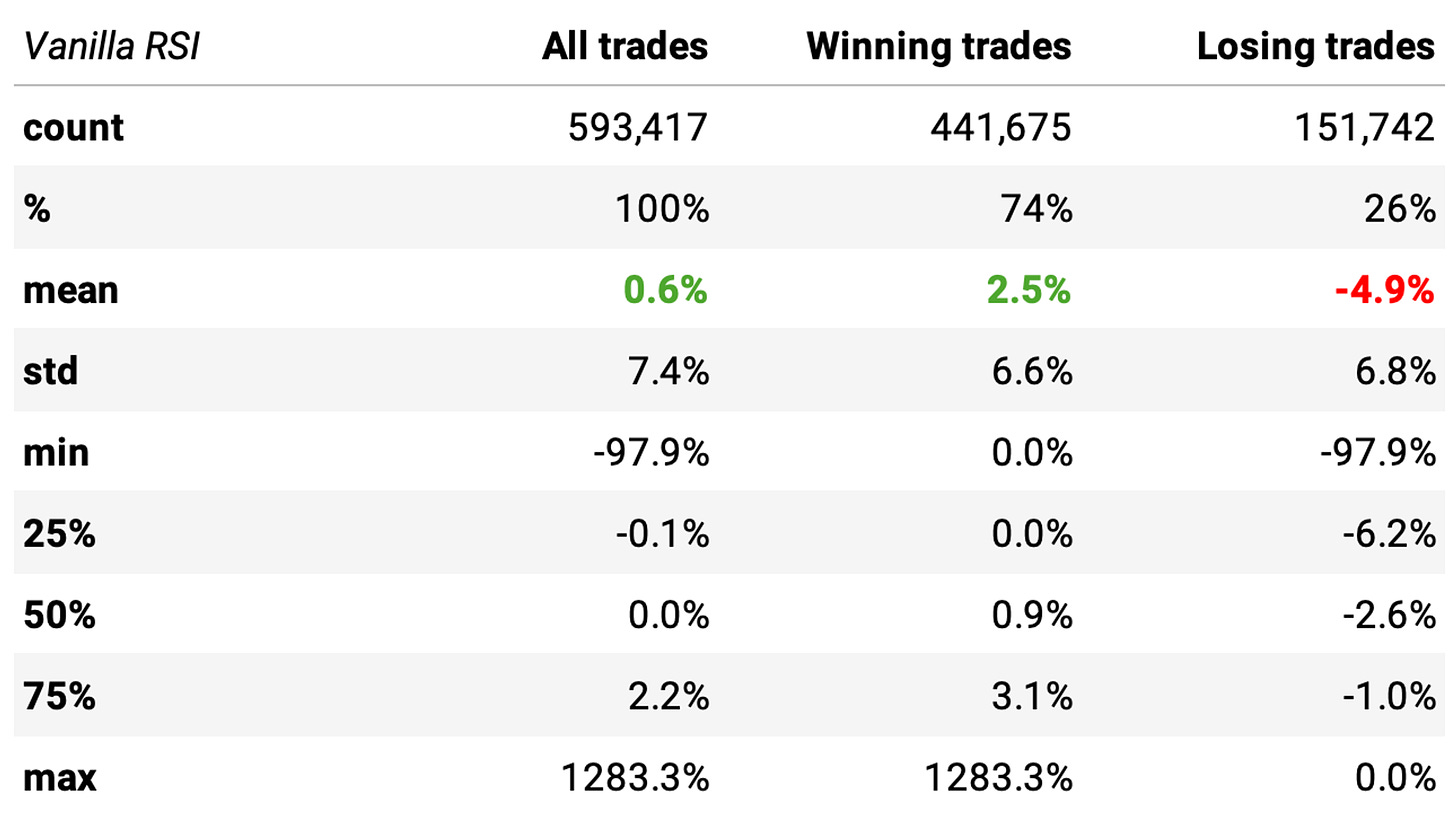
Connors suggests buying whenever the 2-day RSI is below 5 and selling when the stock closes above its 5-day SMA. The highlights:
There have been close to 600,000 events since 1998;
The expected return is 0.6% with a 74% win rate;
Winning trades are expected to return +2.5%, whereas losing ones -4.9%: that's a 0.50 payoff ratio, not good.
But we saw that even the vanilla strategy worked in the previous article (the different numbers are mostly because we changed the exit rules).
Now, we look at the Cumulative RSI:
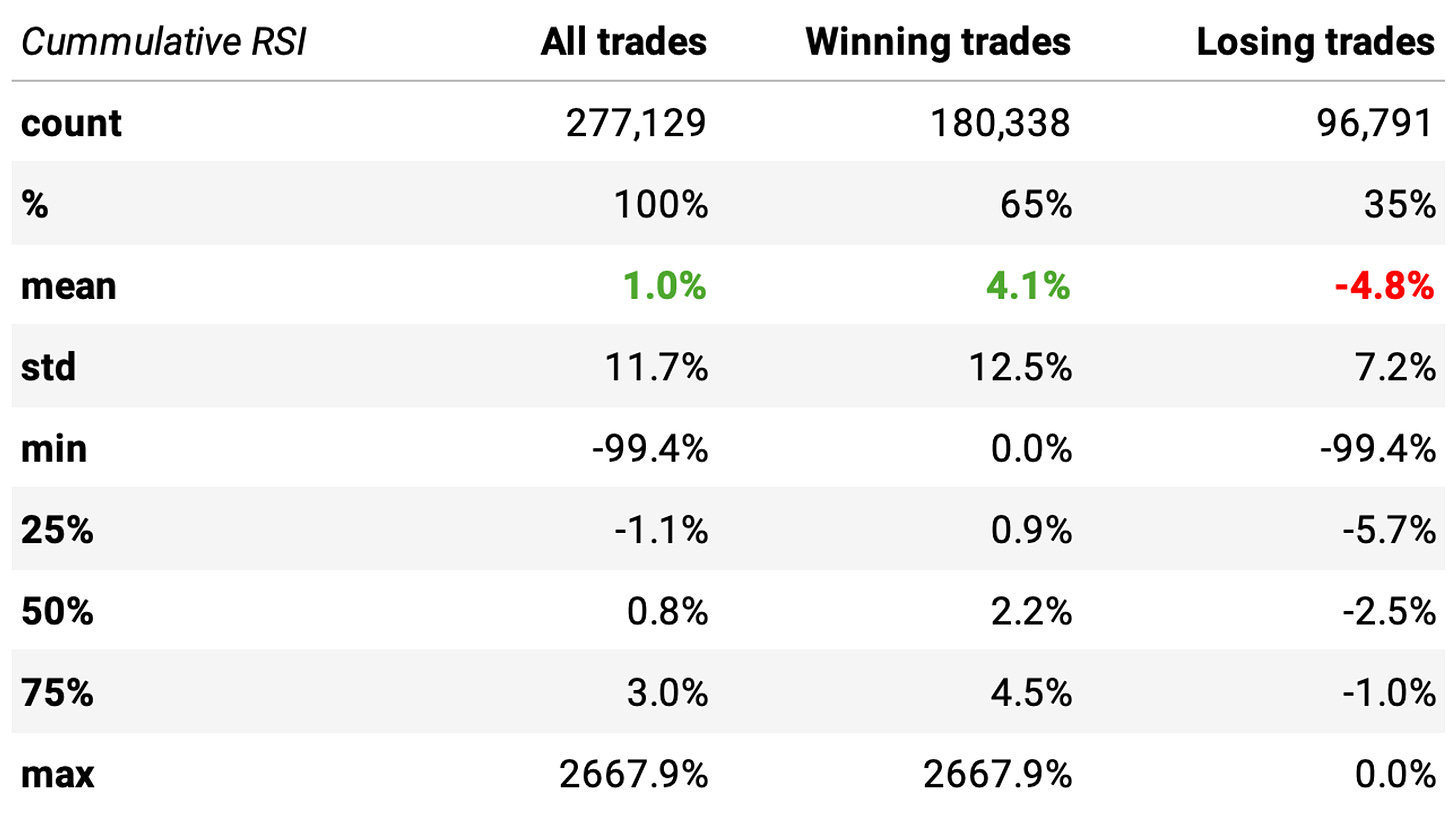
Here, the book suggests buying whenever the 2-day cumulative RSI (2 days) is below 10 and selling whenever it reaches 65. The highlights:
There have been close to 280,000 events since 1998, less than half in comparison to the vanilla RSI strategy;
The expected return is 1.0%, almost twice what we saw previously, ****with a 65% win rate;
Winning trades are expected to return +4.1%, whereas losing ones -4.8%: that's a 0.84 payoff ratio, much better (though I'd obviously prefer above 1).
Finally, we look at non-events:
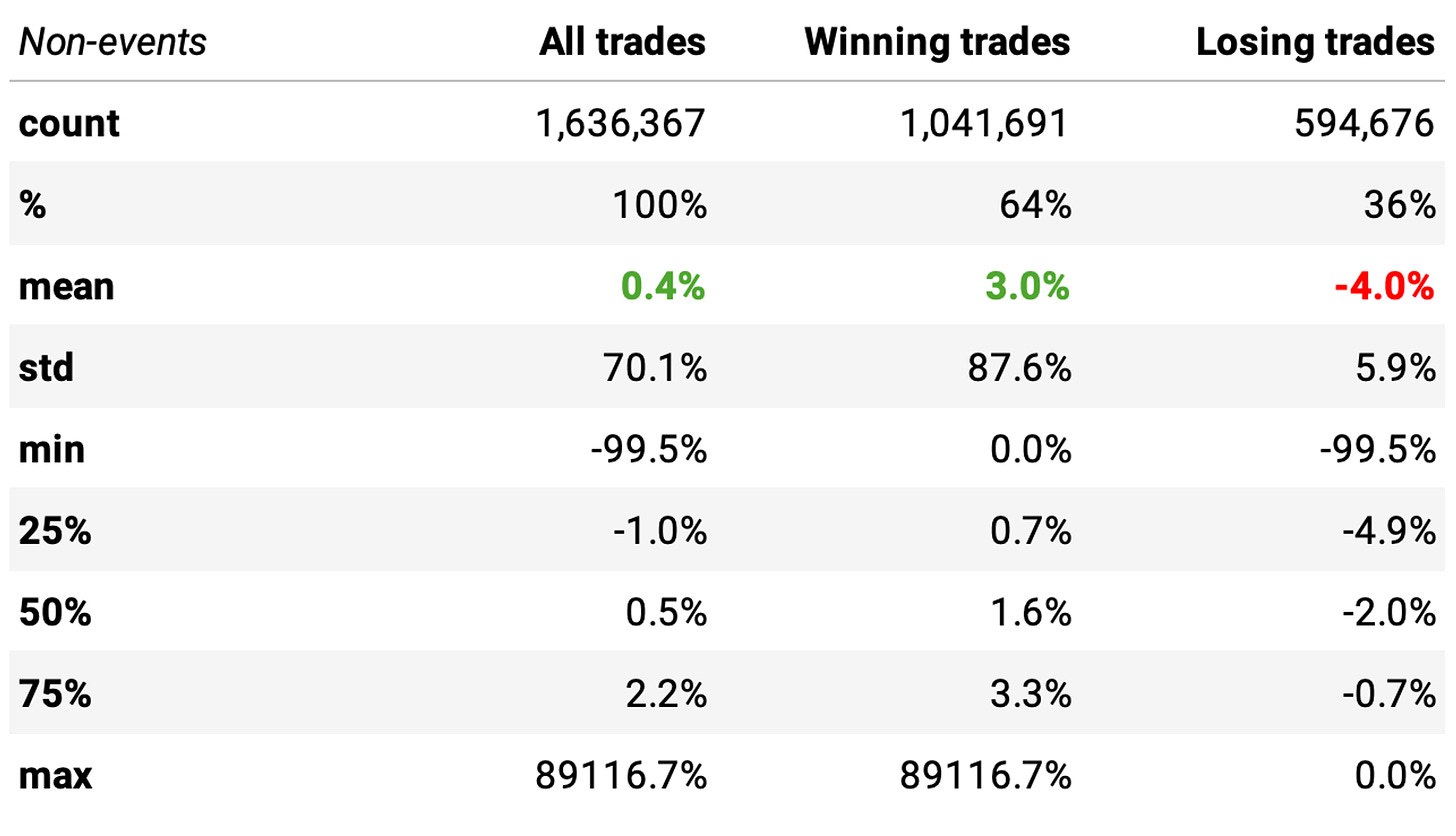
We define those as buying whenever the 2-day cumulative RSI (2 days) is below 65 and holding until it reaches 65, when we sell. As expected, the worst distribution.
But are these distributions different with statistical significance? Let's check the numbers.
Cumulative RSI vs. non-events:
P-value: 9.2e-05 (below 0.05)
✅ The two distributions are significantly different
Cumulative RSI vs. vanilla RSI:
P-value: 4.3e-73 (below 0.05)
✅ The two distributions are significantly different
Cumulative RSIs are indeed a better variation.
Learnings from the previous study
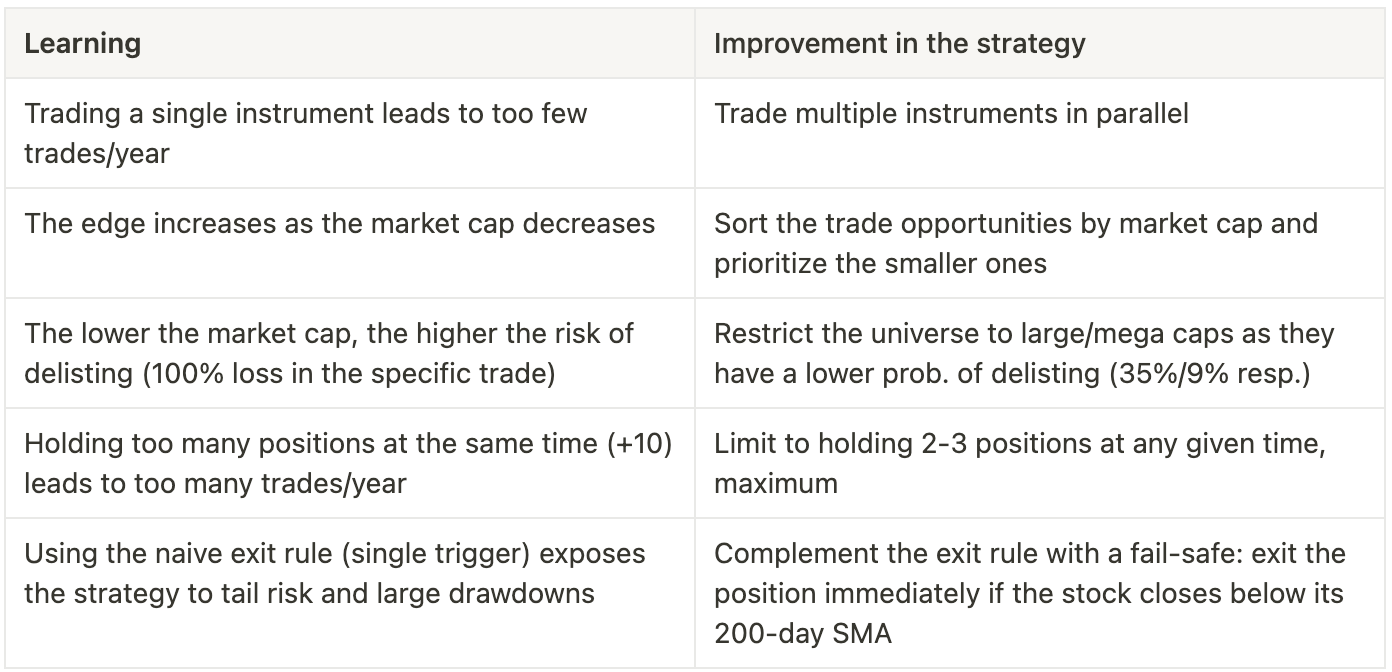
We learned several lessons in my previous article. We will build on them:
Now, let's backtest the strategies. Here's the plan:
First, I will backtest the vanilla strategy: the rules that use the vanilla 2-period RSI (with the additions from the table above). I could use the results from the previous article, but I decided to re-do it because I will use the exact same exit rules as presented by Connors in the book (in the previous article I used a different exit).
Then, I will backtest the enhanced strategy: the rules that use the 2-period Cumulative RSI (2 days), also with the additions from the table above.
Finally, I will do a sensitivity analysis on the parameters to check the robustness of the strategy.
Vanilla strategy (baseline)
The rules for the vanilla strategy:
Whenever the 2-day simple RSI closes below 5, we buy on the next opening;
Whenever the stock closes above its 5-day SMA, we exit on the next opening;
We only trade a stock if its price is above its 200-day SMA;
We trade multiple stocks in parallel to increase exposure;
If there are more than 3 opportunities to trade on any given day, we sort them by market cap and prioritize the lower market caps;
We restrict ourselves to trade only large & mega caps to reduce the risk of delisting;
We limit to holding 3 positions at any given time, maximum;
Whenever the stock closes below its 200-day SMA, if we have a position, we exit at the next open.
To ensure we trade only liquid stocks:
We will restrict ourselves to only trade stocks that have been traded in all sessions over the past 3 months from the day in question;
We will only trade the stock if the allocated capital for the trade does not exceed 5% of the stock's median ADV of the past 3 months from the day in question.
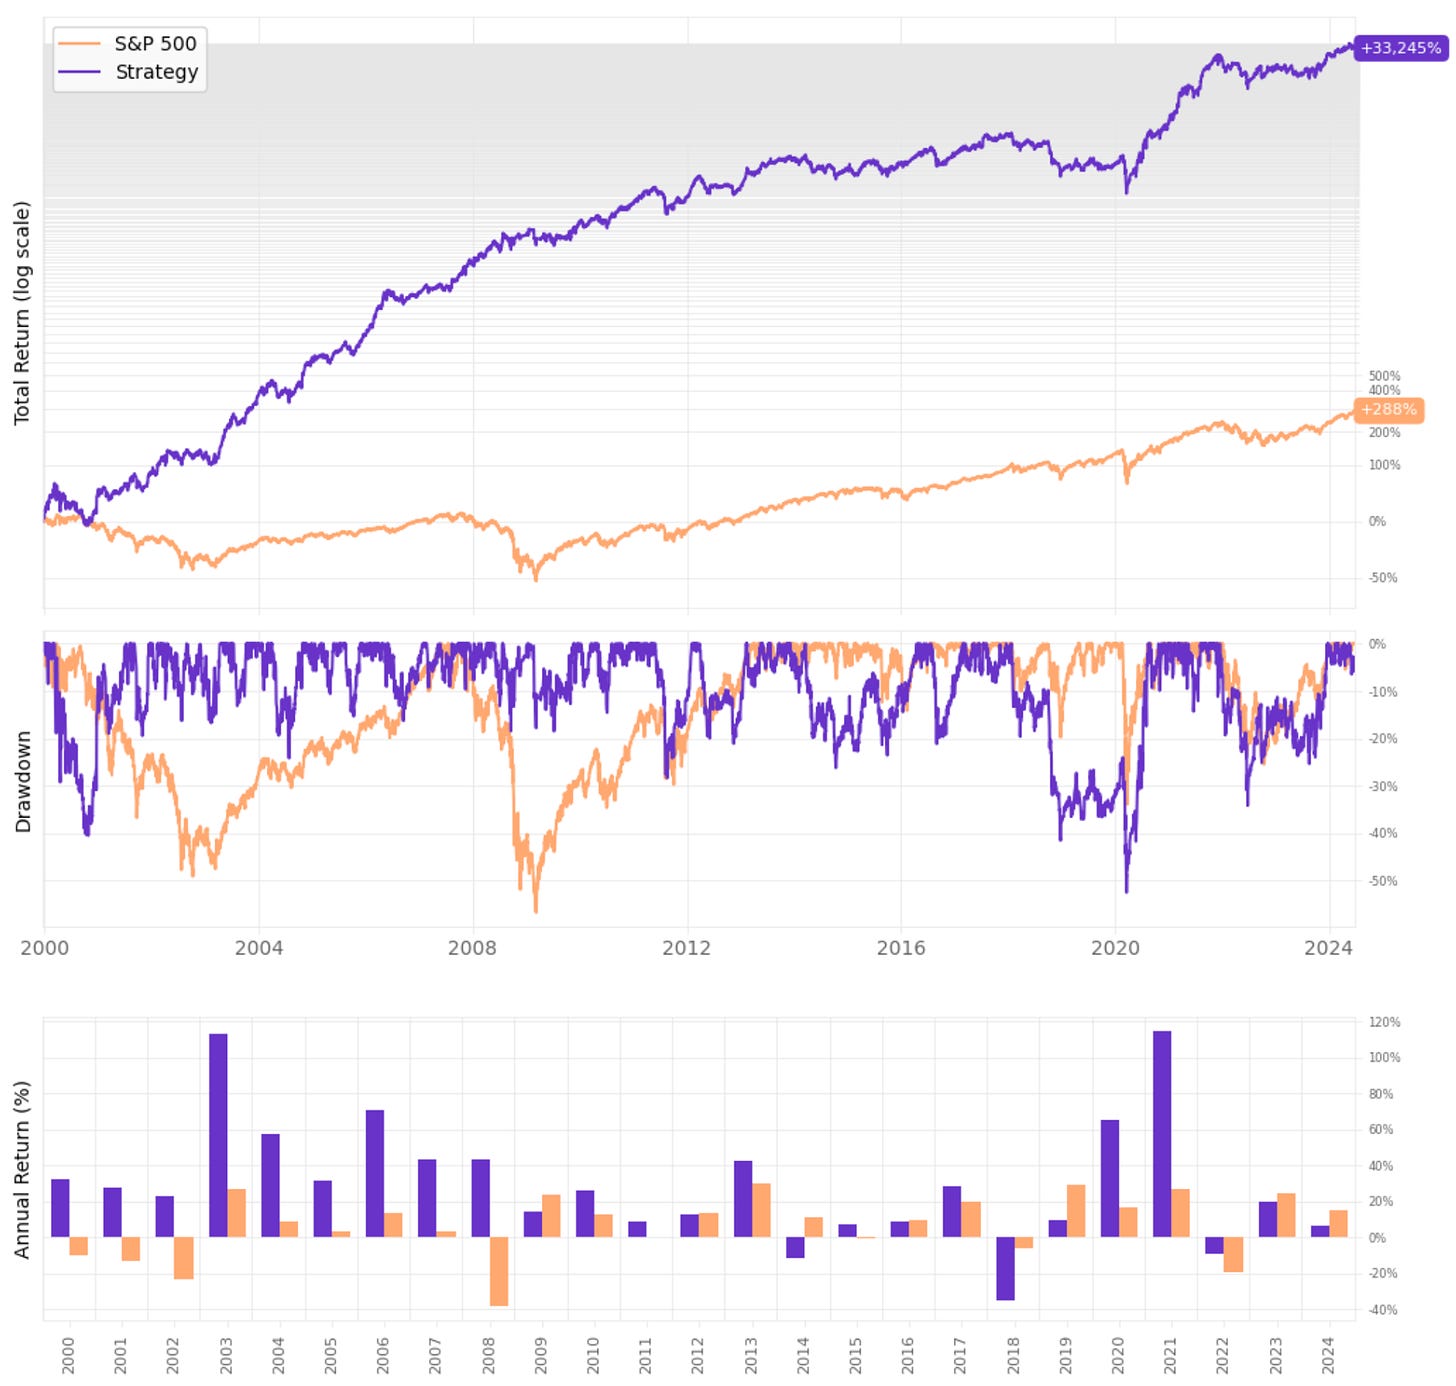
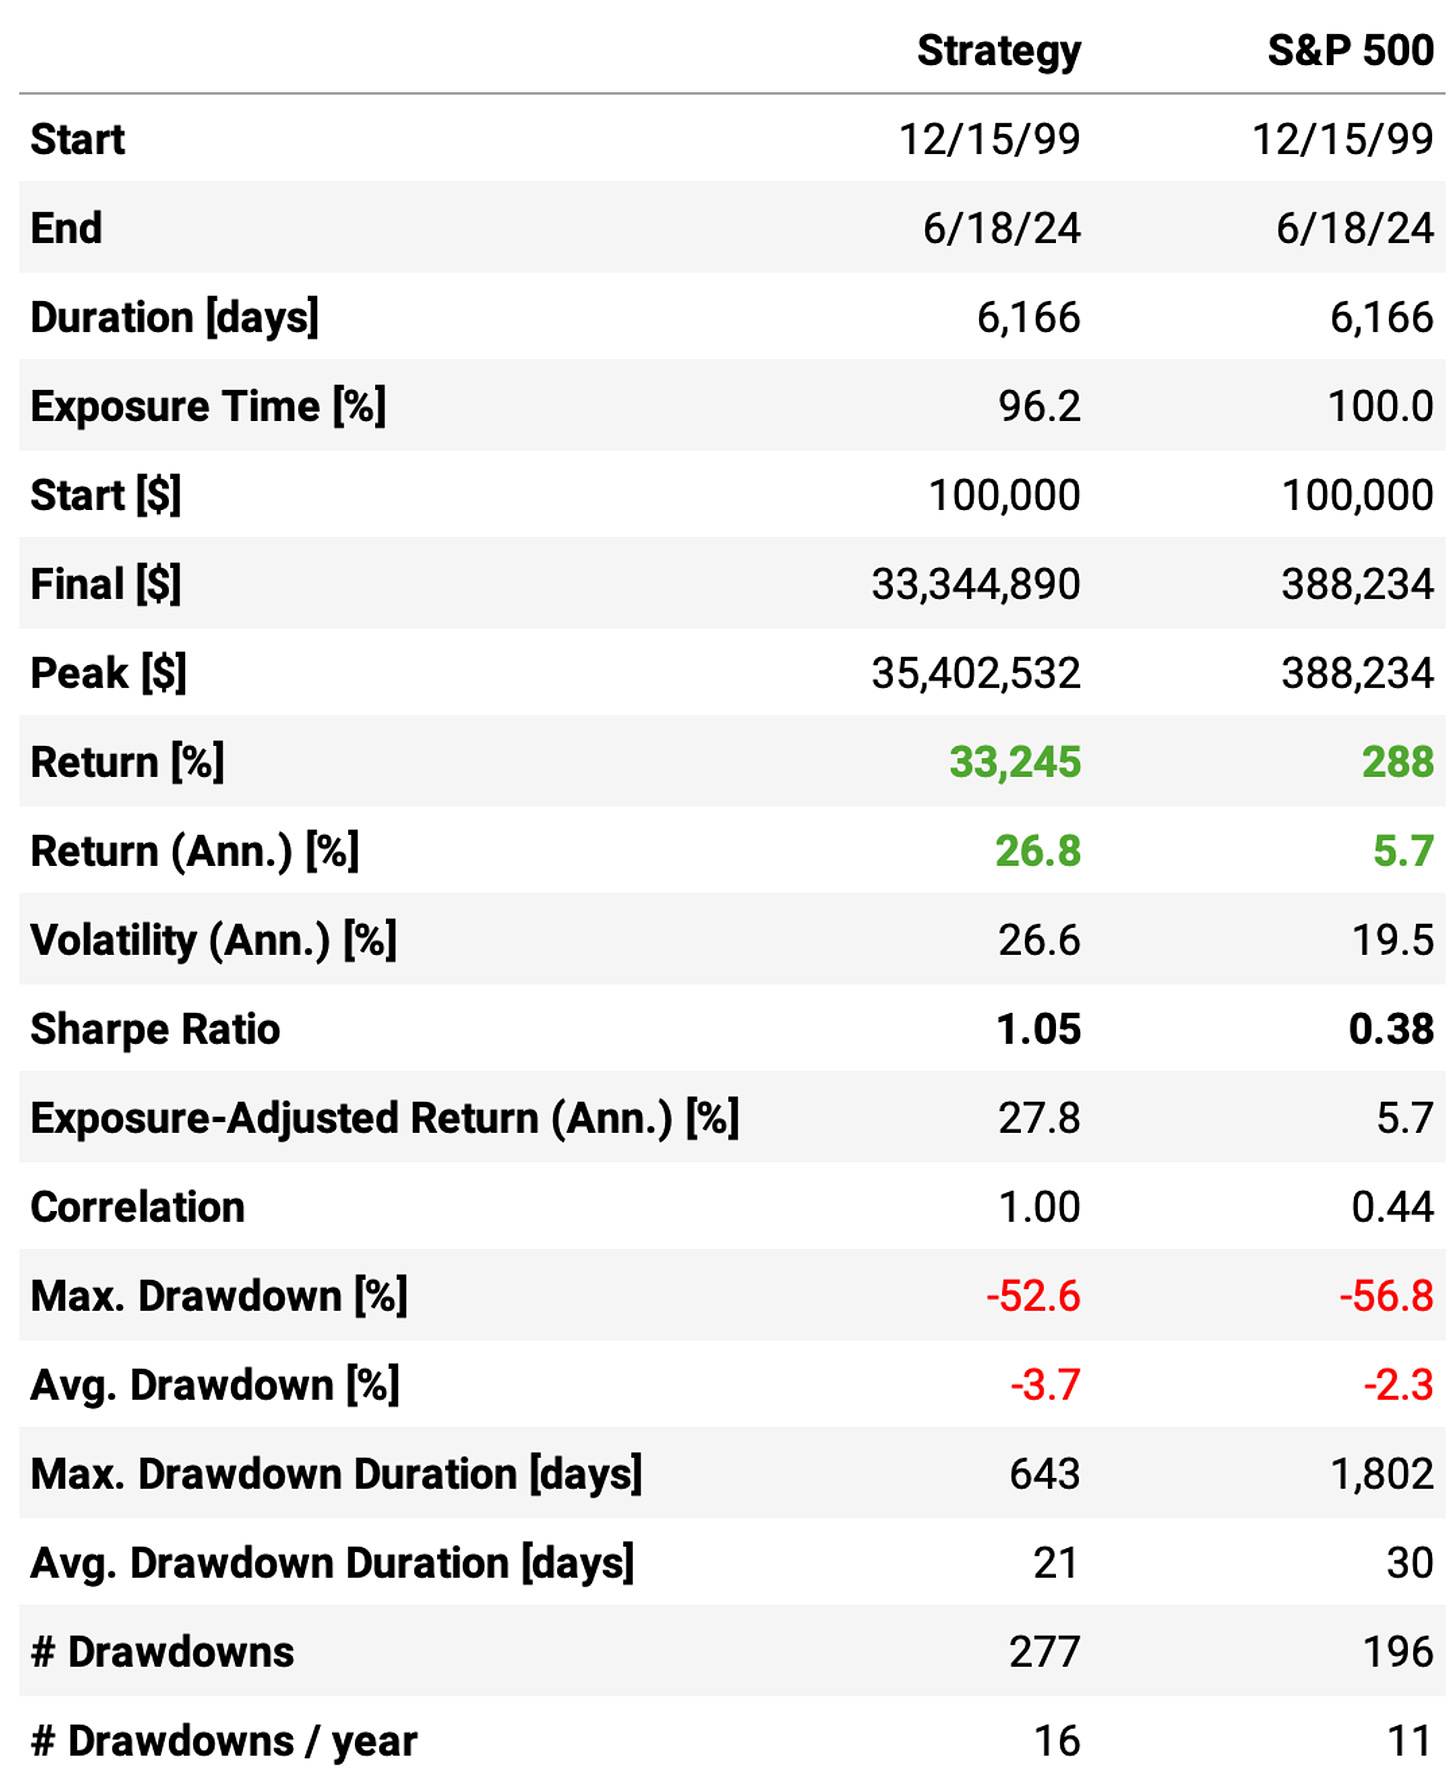
Here are the results:
The results are pretty similar to what we achieved in the previous article (small differences are due to the different exit strategy). I'm not going to re-discuss the results: for a full discussion, please check the last article.
I only re-implemented so we can have a baseline to compare with the enhanced strategy.
Enhanced strategy
Now, let's look at the enhanced strategy. It uses the 2-day Cumulative RSI (2 days) instead of the vanilla version. The rules in detail:
Whenever the 2-day cumulative RSI (2 days) is below 10, we buy on the next opening;
Whenever the 2-day cumulative RSI (2 days) is above 65, we exit on the next opening;
We only trade a stock if its price is above its 200-day SMA;
We trade multiple stocks in parallel to increase exposure;
If there are more than 3 opportunities to trade in any given day, we sort them by market cap and prioritize the lower market caps;
We restrict ourselves to trade only large & mega caps to reduce the risk of delisting;
We limit to holding 3 positions at any given time, maximum;
Whenever the stock closes below its 200-day SMA, if we have a position, we exit at the next open.
To ensure we trade only liquid stocks:
We will restrict ourselves to only trade stocks that have been traded in all sessions over the past 3 months from the day in question;
We will only trade the stock if the allocated capital for the trade does not exceed 5% of the stock's median ADV of the past 3 months from the day in question.
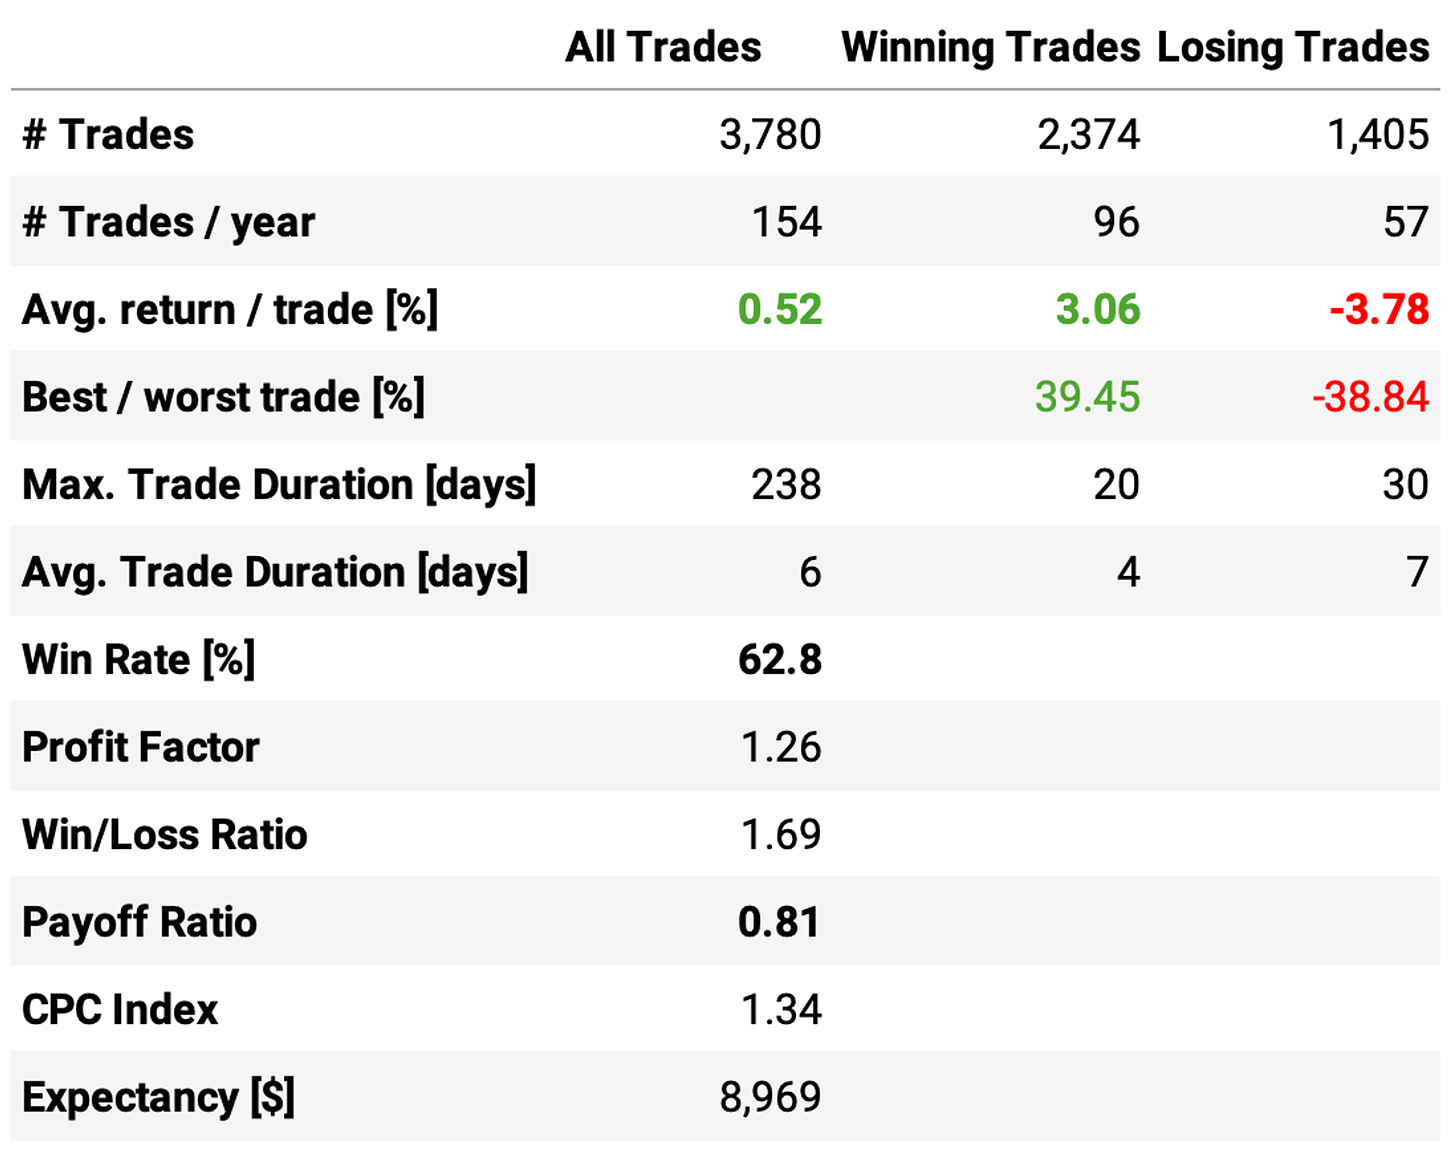
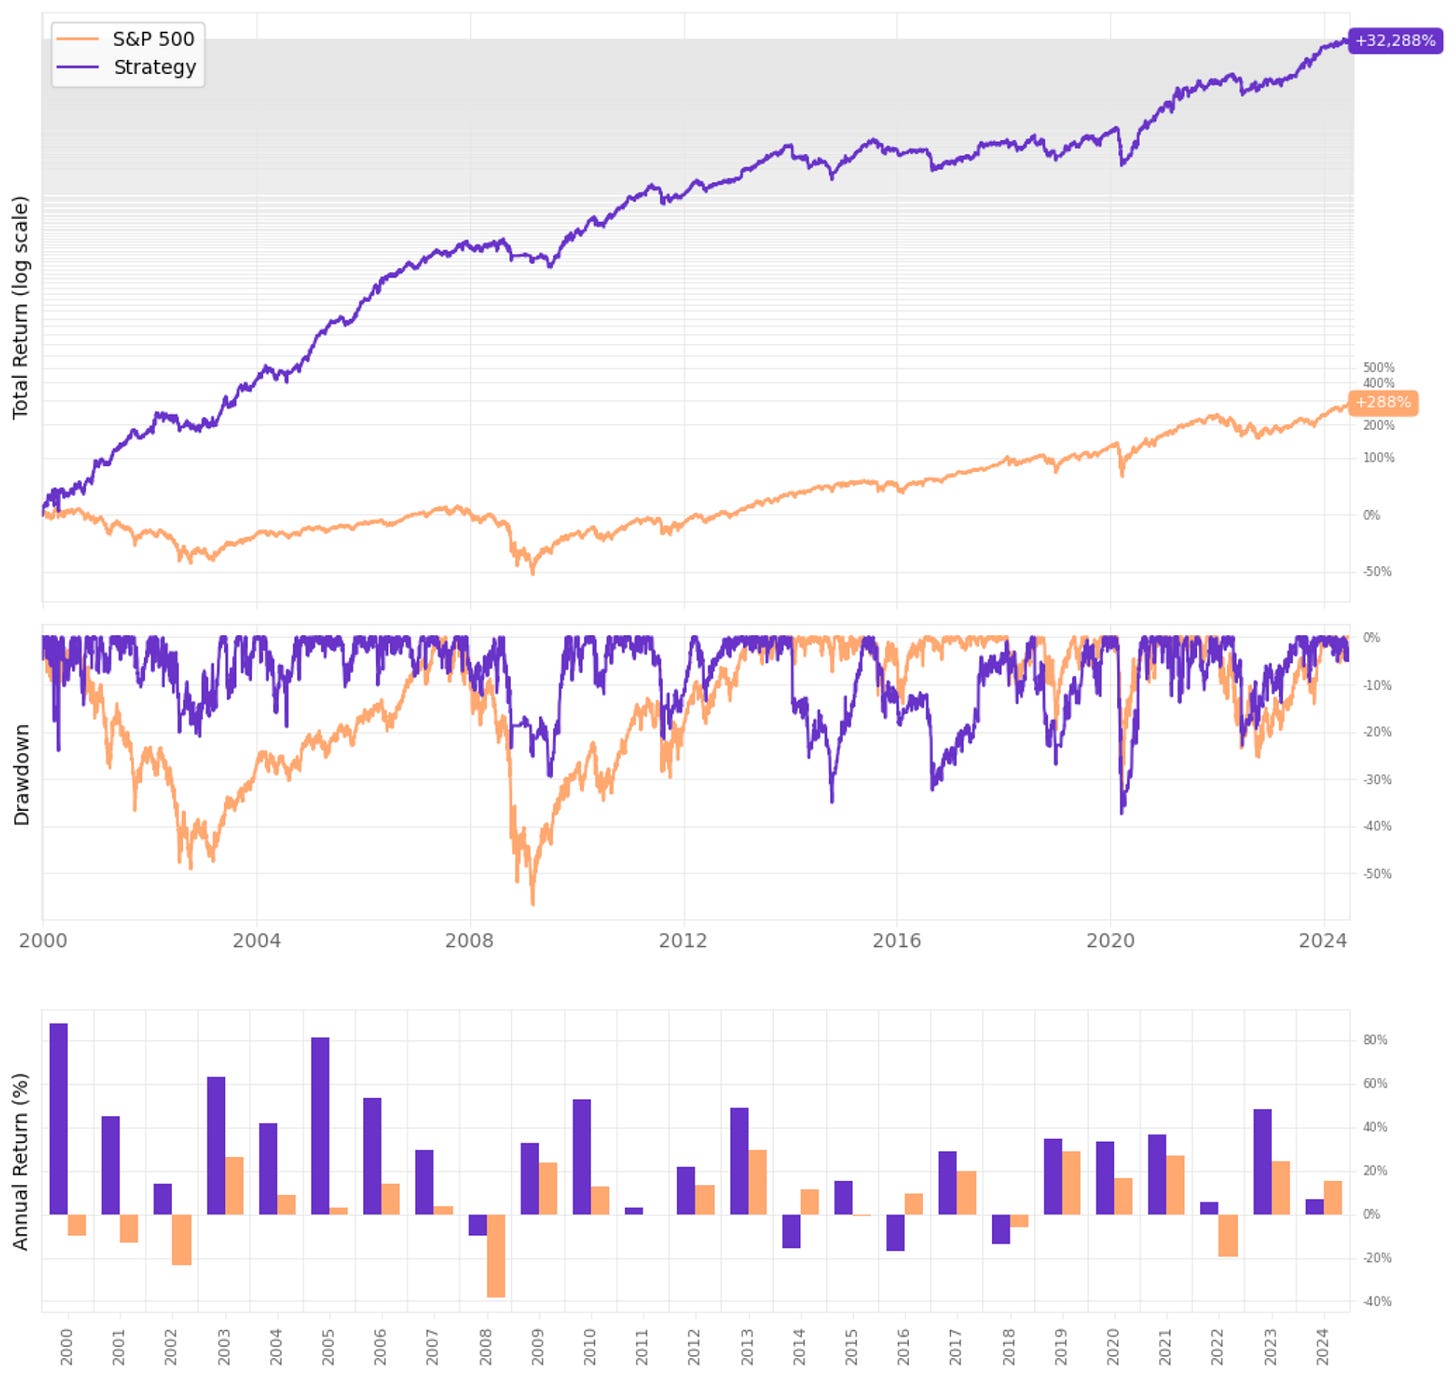
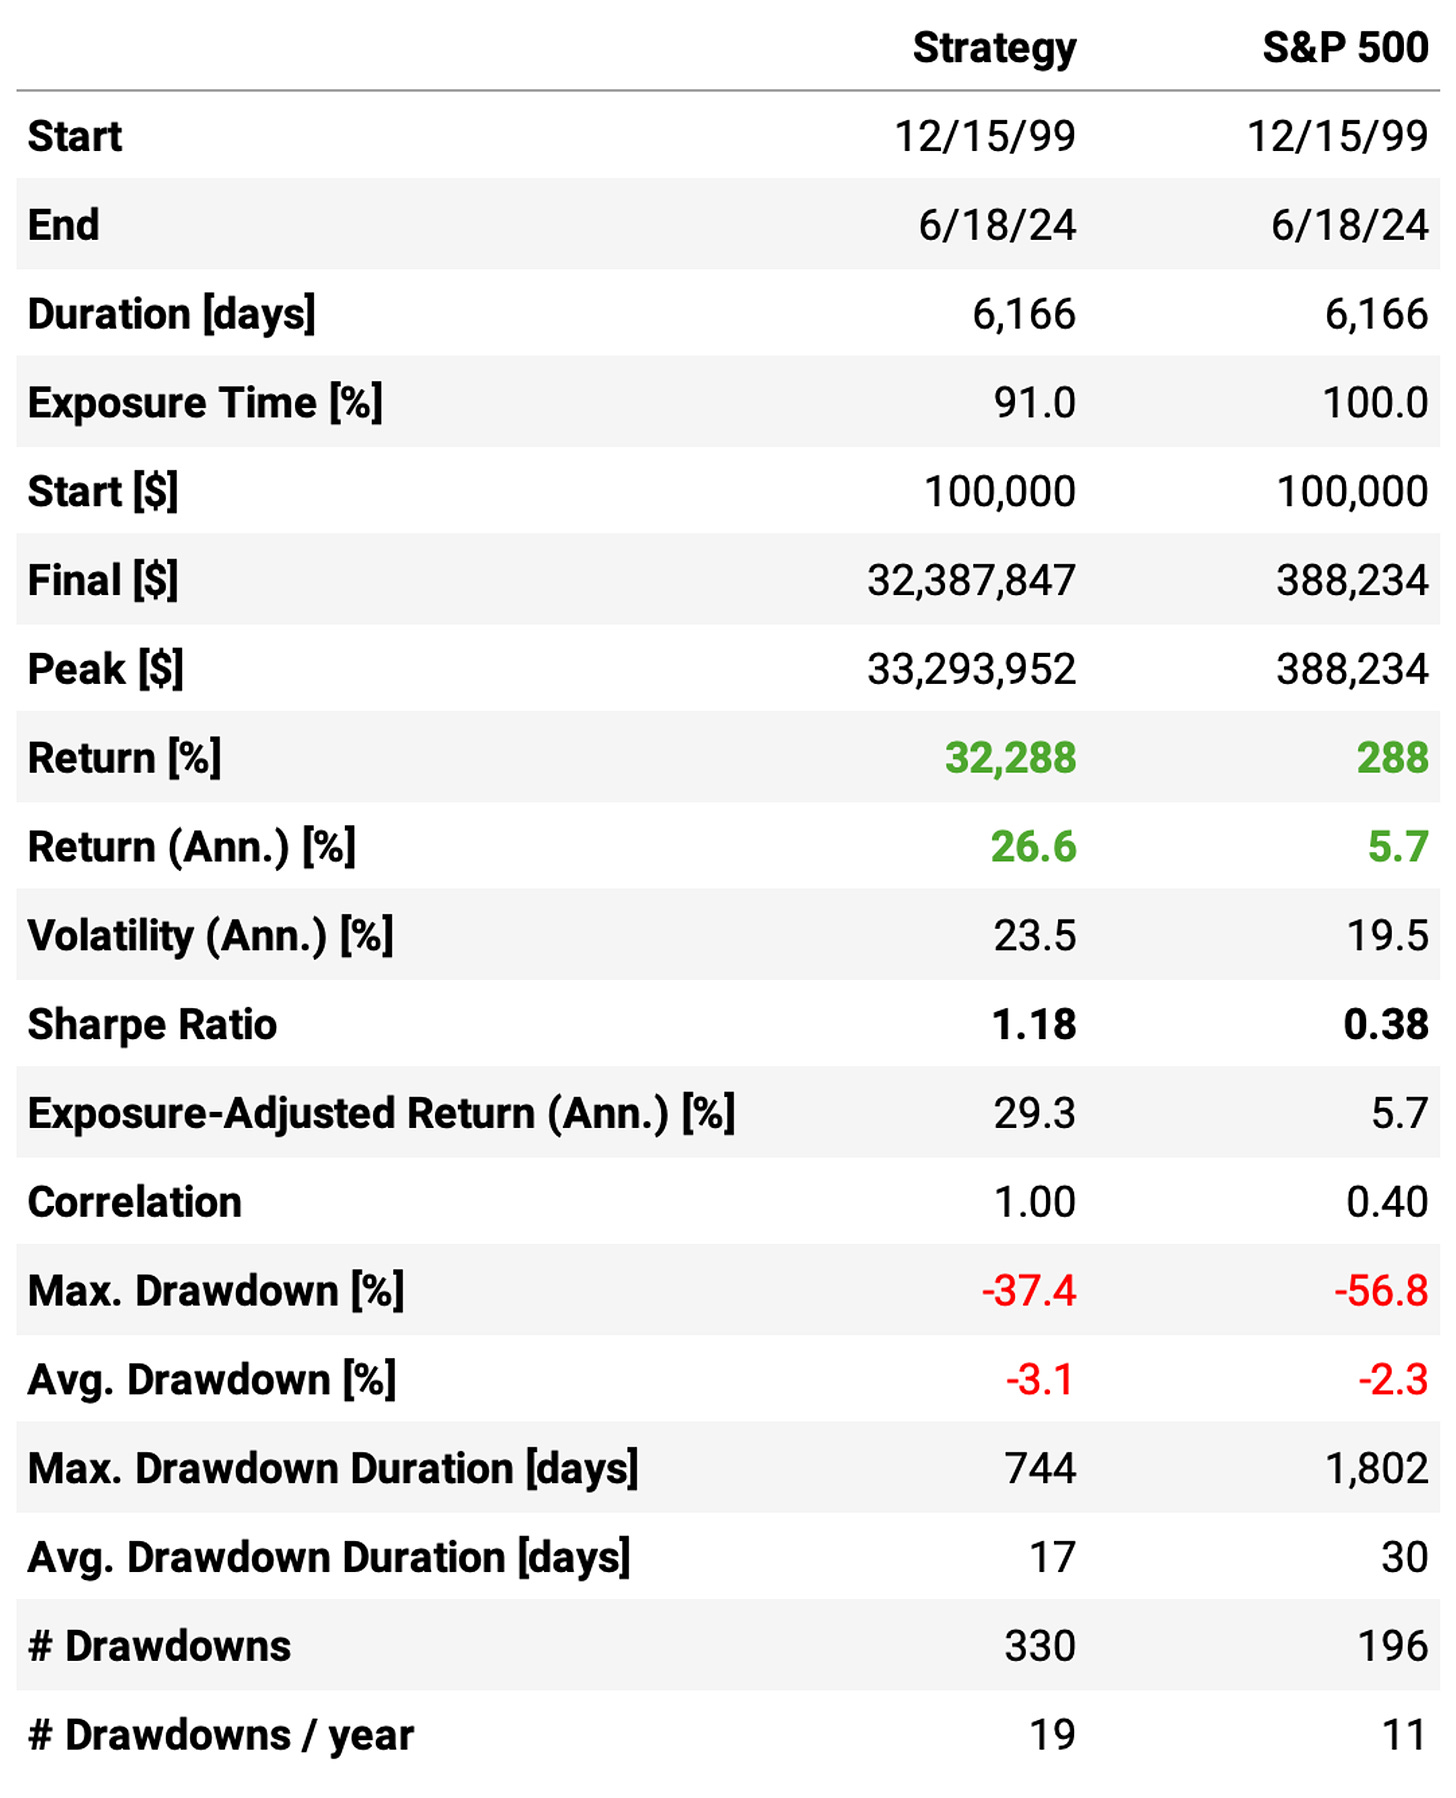
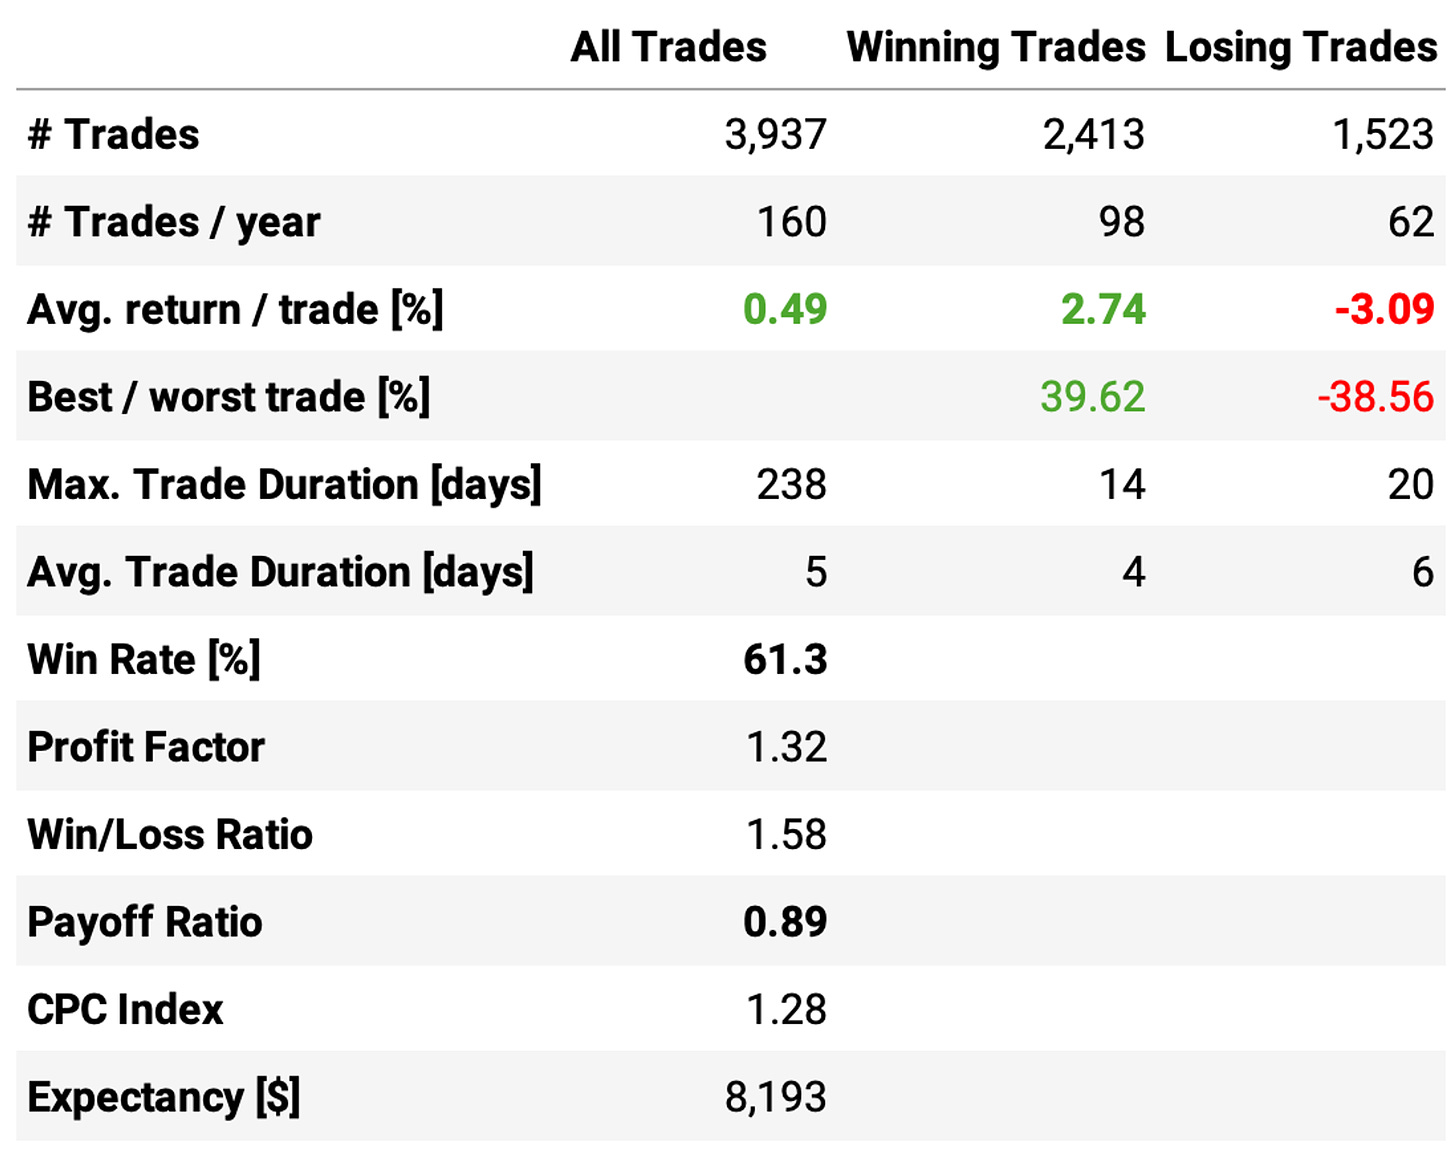
Let's see the results:
The enhanced strategy is better than the vanilla strategy, but marginally. Here are the highlights:
The annual returns are almost the same: 26.6% vs. 26.8%;
Using Cumulative RSI improves the Sharpe: 1.18 vs. 1.05;
However, although maximum drawdown is better (37% vs. 57%), it's still too high.
This system delivers 4x more annual return than the S&P 500, which compounds to a large difference in 24 years of backtest. However, the 37% maximum drawdown would be too much for me.
Sensitivity analysis
Now, let's perform a sensitivity analysis to see how changes in parameters affect the strategy's performance. If the strategy is highly sensitive to small changes, it may be overfitted.
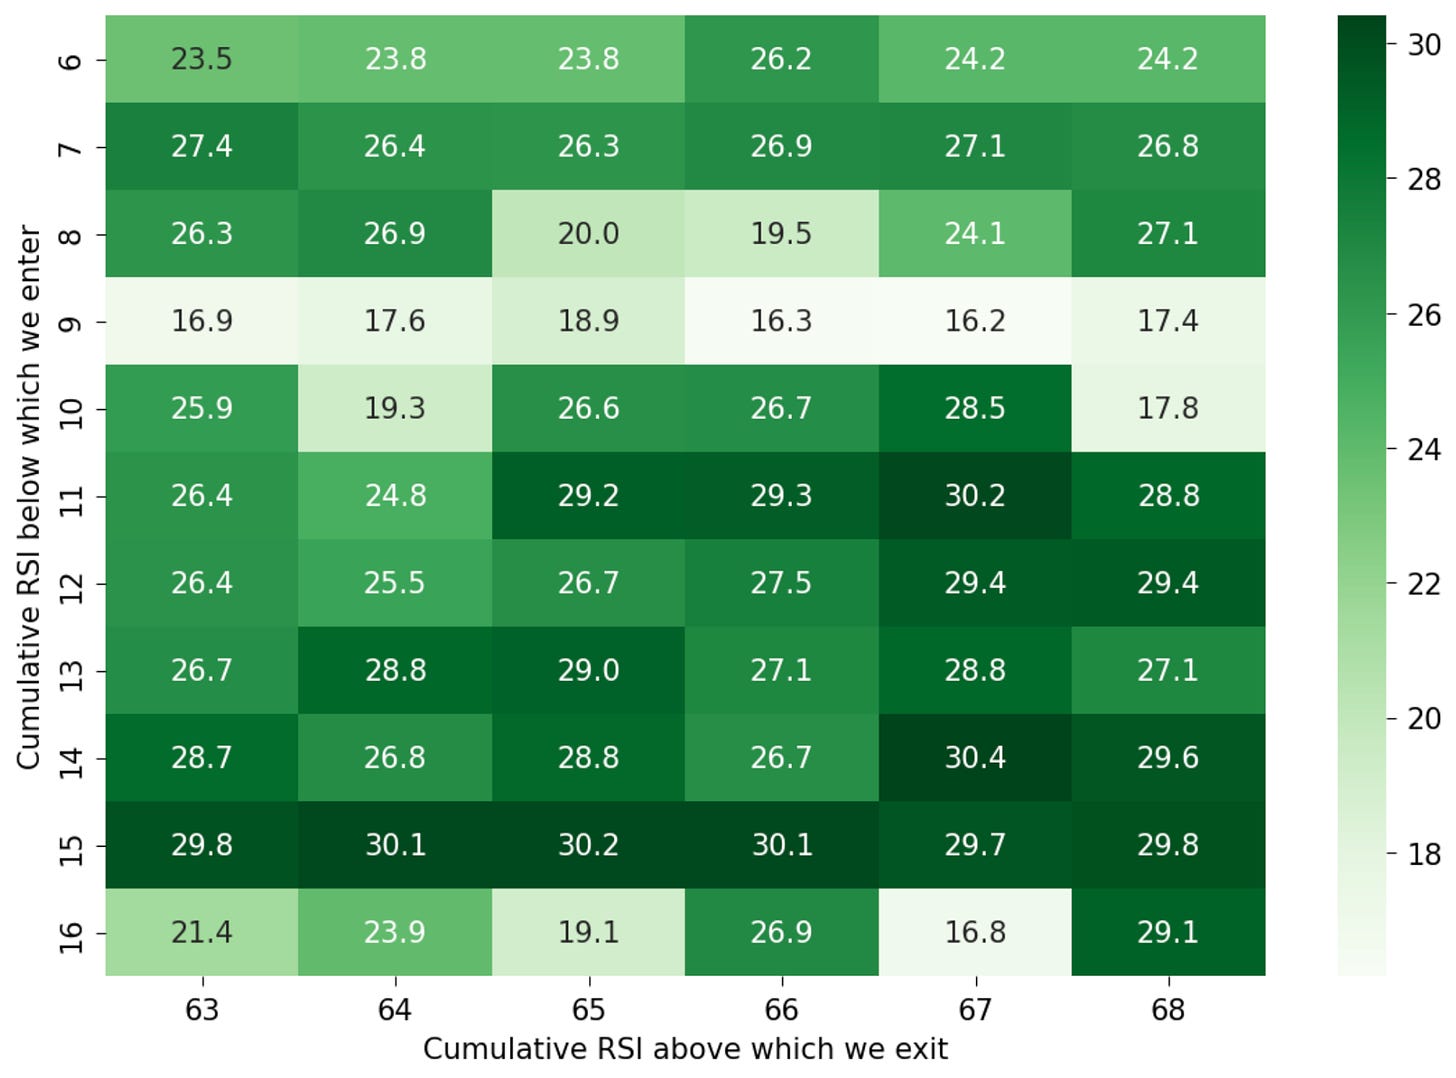
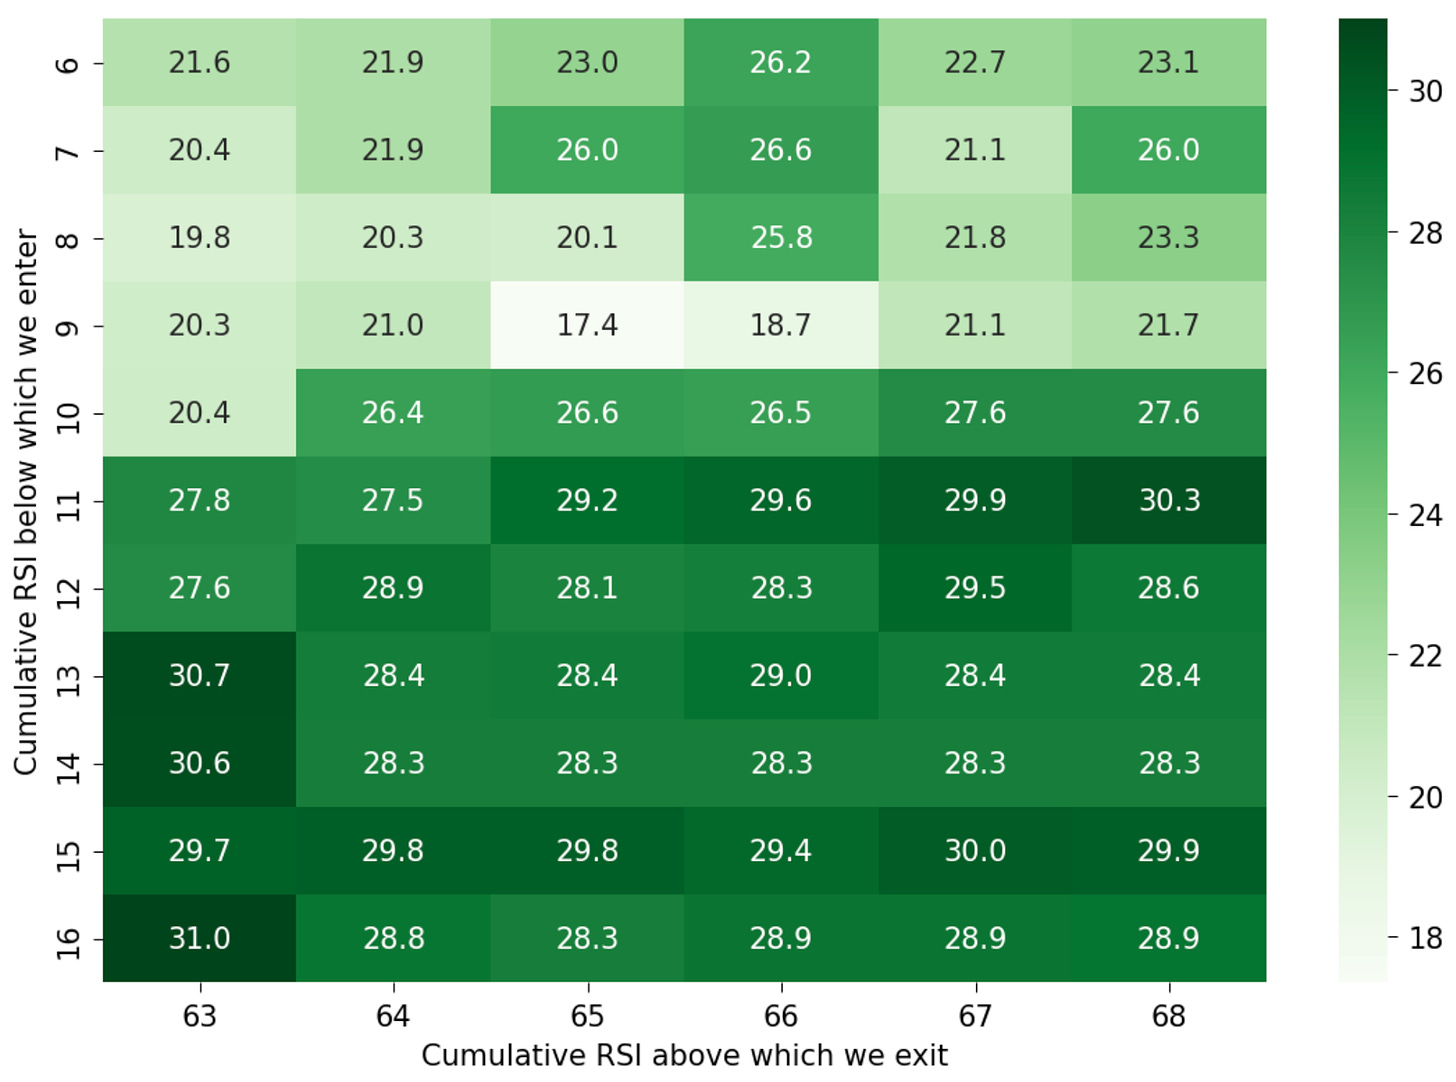
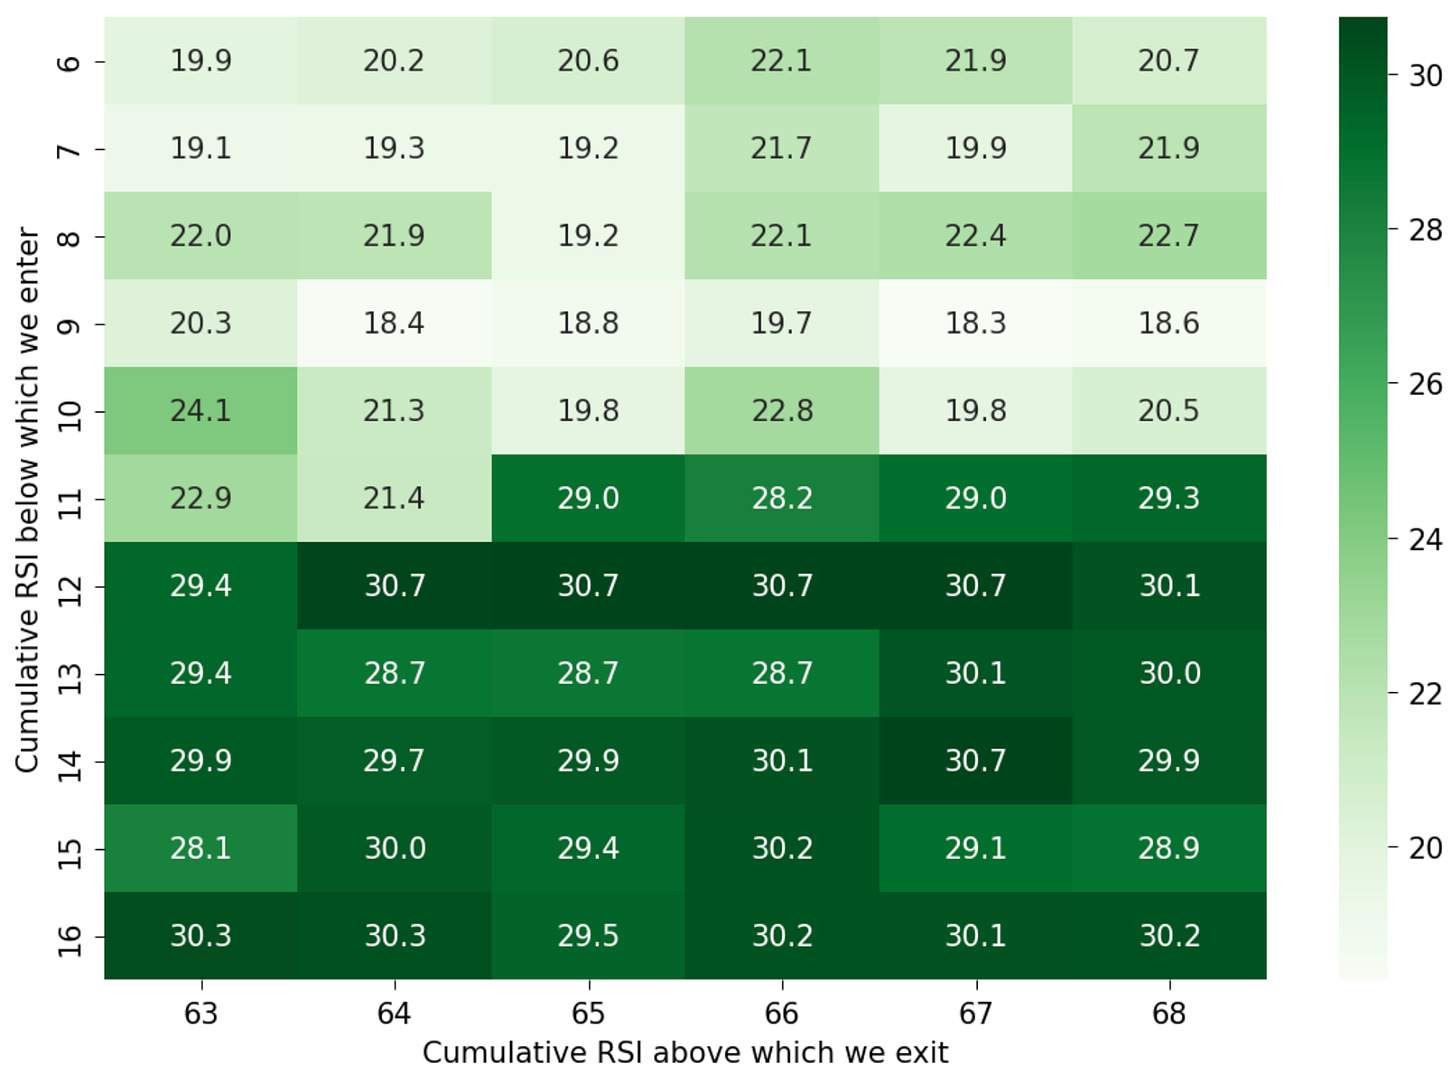
We explore the following parameter space:
Maximum positions held at any given time: [2, 3, 4]
Cumulative RSI below which we enter: [6, 7, 8, 9, 10, 11, 12, 13, 14, 15, 16]
Cumulative RSI above which we exit: [63, 64, 65, 66, 67, 68]
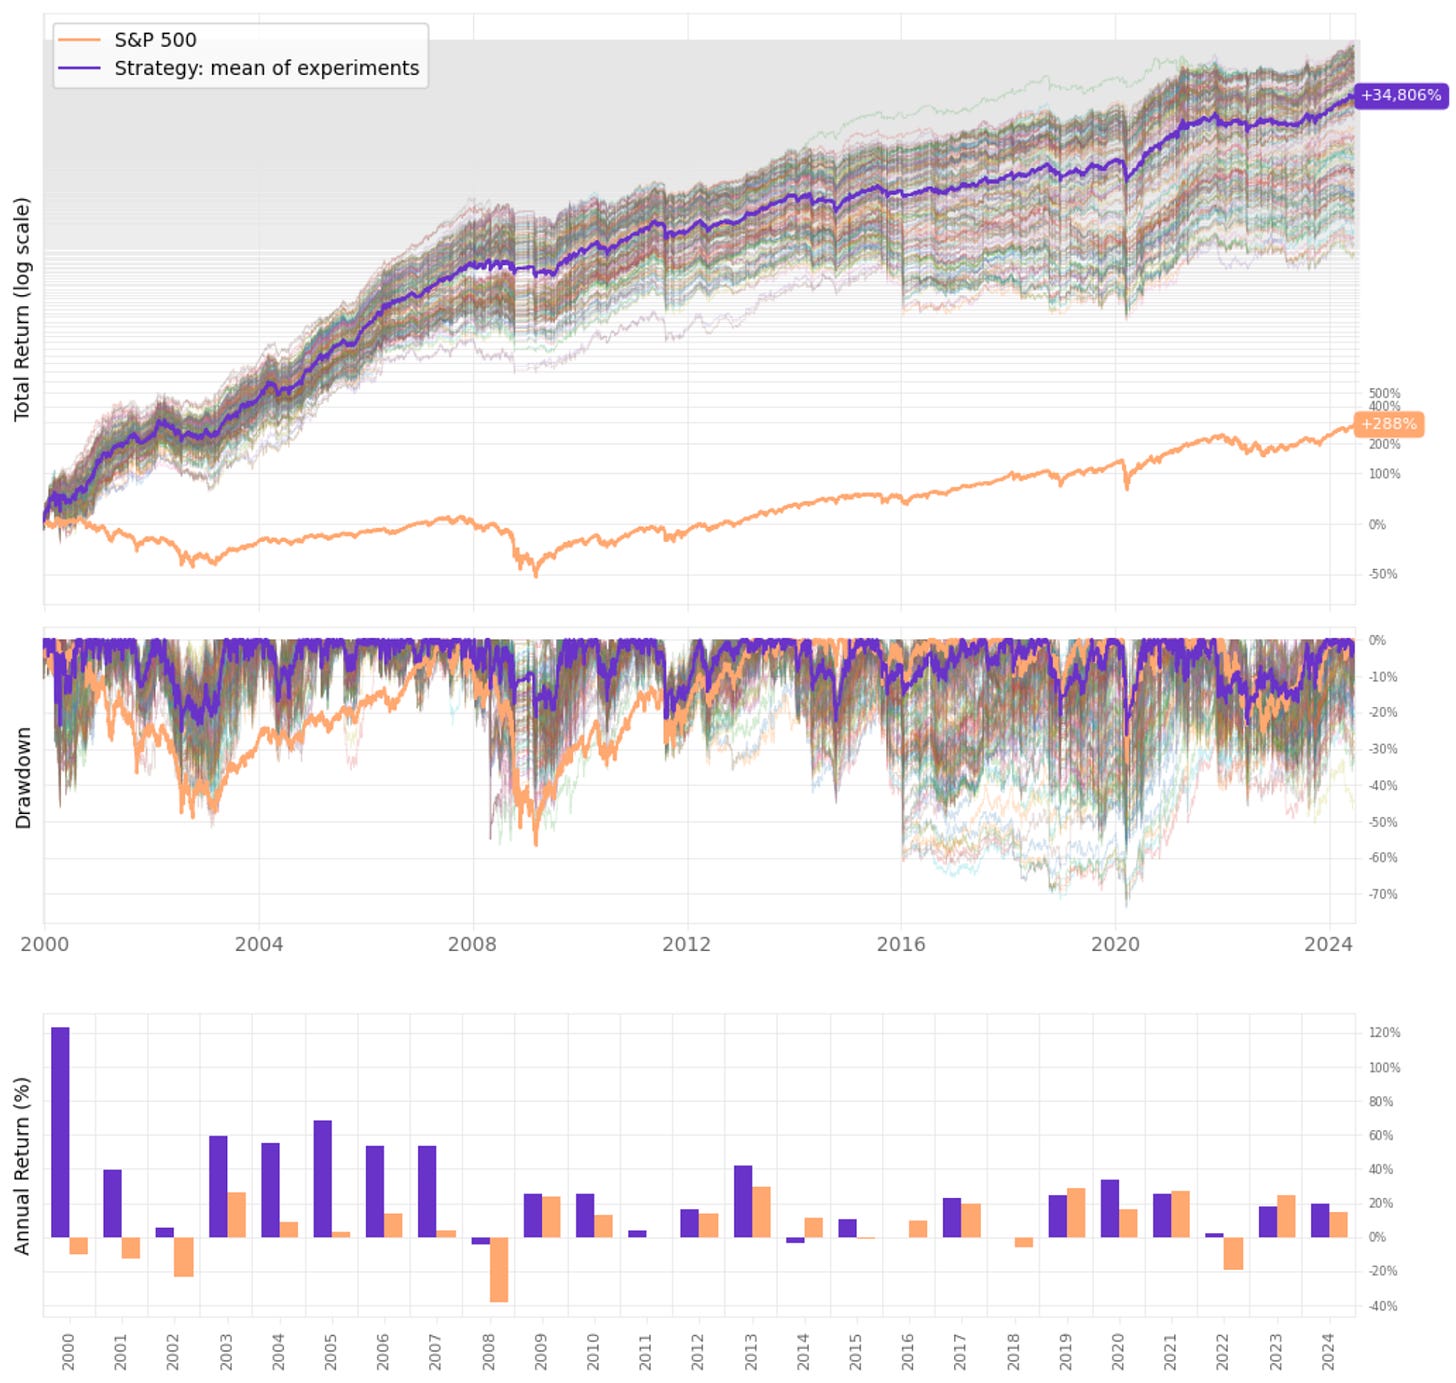
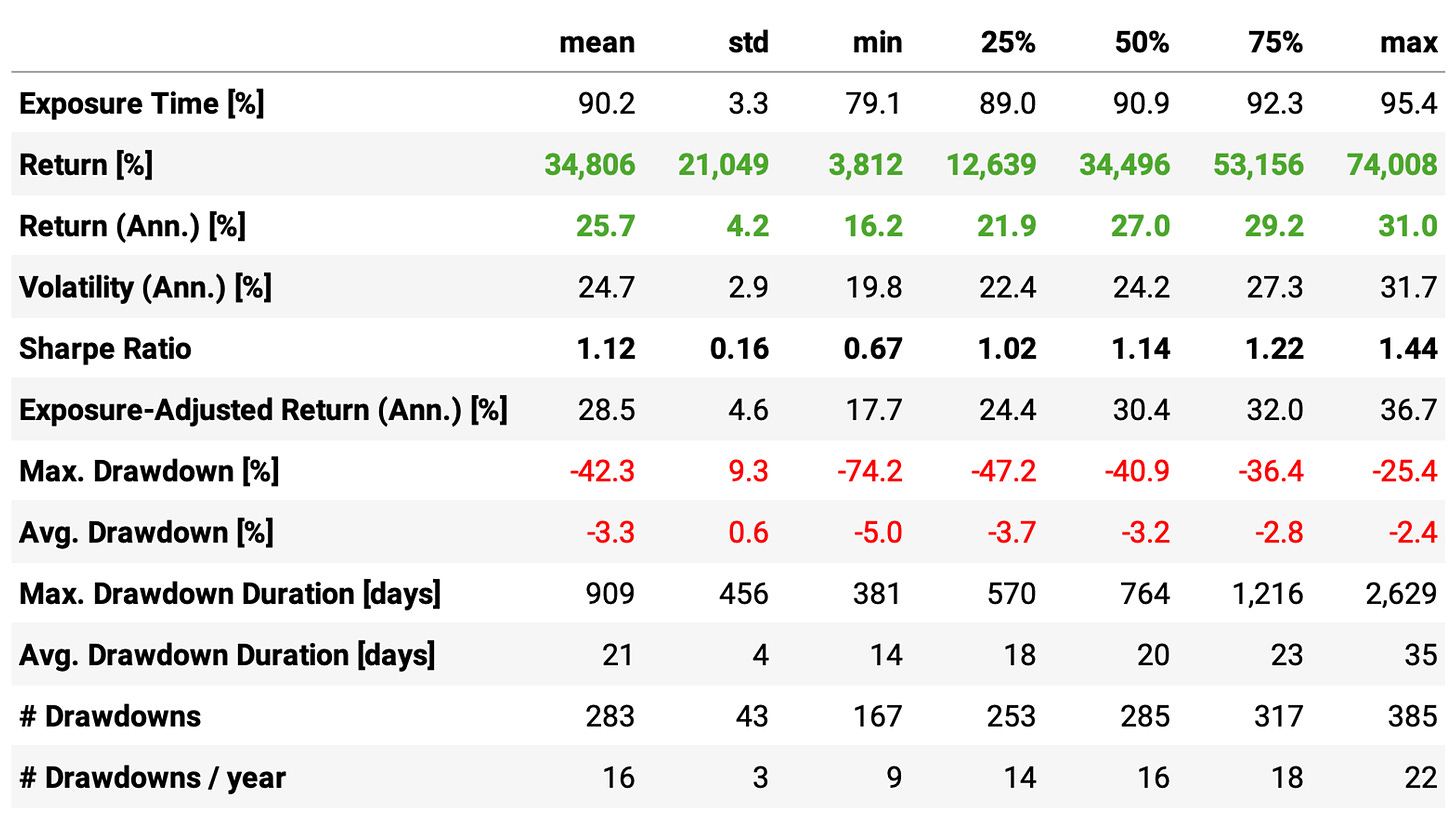
This parameter space has 198 experiments. Let's see the results:
The mean annual return of 25.7%, with minimum and maximum values of 16.2% and 31%, suggests that the strategy is robust: all 198 experiments delivered a return well above the benchmark;
However, the mean maximum drawdown of 42%, although still lower than the benchmark, is still too high: the maximum maximum drawdown reaches 74% for an experiment, while the minimum maximum drawdown is 25% (still above 20%);
Looking at the heatmaps for maximum positions of 3 and 4, we see that it's generally a good idea to enter trades when the cumulative RSI is above 11-12 until 16; using values between 6 and 9 is suboptimal.
Final thoughts
When I started this study, I thought I would be able to squeeze more profits out of this mean-reversion strategy by using cumulative RSI, as pointed by Connors on his book. When I saw the statistical edge of cumulative RSIs in comparison to vanilla RSIs, I was sure it could be done.
However, this was not the case. Although it is true that using cumulative RSIs improved the risk-adjusted return and reduced the drawdown in comparison to the system using vanilla RSIs, the annual return is pretty similar.
And even if we had managed to get a higher return, the enhanced strategy still shows a 37% drawdown, way higher than what most people could stomach (15-20% max).
On top of that, we observed that the enhanced strategy significantly outperformed the S&P 500 every single year from 2000 to 2013, but from 2014 on, it underperformed in some years (2014, 2016 and 2018). This suggests a mean-reversion strategy based on the signals shown is losing its edge.
Would I trade this strategy? No. Would I give up looking for mean-reversion signals and strategies? Also no. There are several ideas in the pipeline, I'm still deciding what to test next week.
I'd love to hear your thoughts about this approach. If you have any questions or comments, just reach out via Twitter or email.
Also, if you want to implement this strategy (or any other strategy) and need help, just let me know.
Cheers!


Thank you for sharing these experiments, even though they didn't turn out as expected. Your willingness to share both successes and failures speaks to your dedication and seriousness. I appreciate it!
Hey quantitativo, I've enjoyed reading through your posts. You may want to consider including transaction costs along with varying levels of slippage. Aside from that, sensitivity analysis and parameter selection may be more practical on a walk forward basis. Regardless, great work!