Playing with the universe
A 30% annual return mean reversion strategy focused only on Nasdaq-100 constituents
The idea
"It's not that I'm so smart; it's just that I stay with problems longer.” Albert Einstein.
I love this quote from Einstein. It shows the importance of persistence and perseverance in the face of challenges. This mindset emphasizes the value of hard work and resilience, which is crucial in developing trading systems.
Challenge is a word that can summarize my past week pretty well. I tried dozens of different ideas, but nothing quite worked. Yesterday, after missing my ideal publish date (Saturdays), I decided to take an existing idea, try to improve it, and write about it.
My first thought was to play with the universe. I acquired a new dataset, Norgate Data, which is also a survivorship-bias-free dataset like the Sharadar Core US Equity Bundle (the dataset I've been using so far). The difference is that Norgate provides current and past constituents for several indices: S&P 500, Nasdaq-100, Russell 2000, etc. The package offers 29 indices with historical constituents, which is great for correctly testing ideas within different universes.
Also, several people on Twitter asked about slippage and trading costs. So, by the end, I will analyze the impact of costs on the results.
The plan for this article:
First, we will evaluate the edge of a mean-reversion strategy, particularly focusing on Nasdaq-100 constituents (current & past);
Then, we will do some experiments playing with different exit rules and maximum number of positions;
Finally, we will see how (obviously) increasing trading costs impact the overall results.
The edge
We will focus on a simple idea I shared some weeks ago: buying stocks whenever their 2-period RSI closes below 5 (and the stock price is above its 200-day SMA) and holding them for a few days.
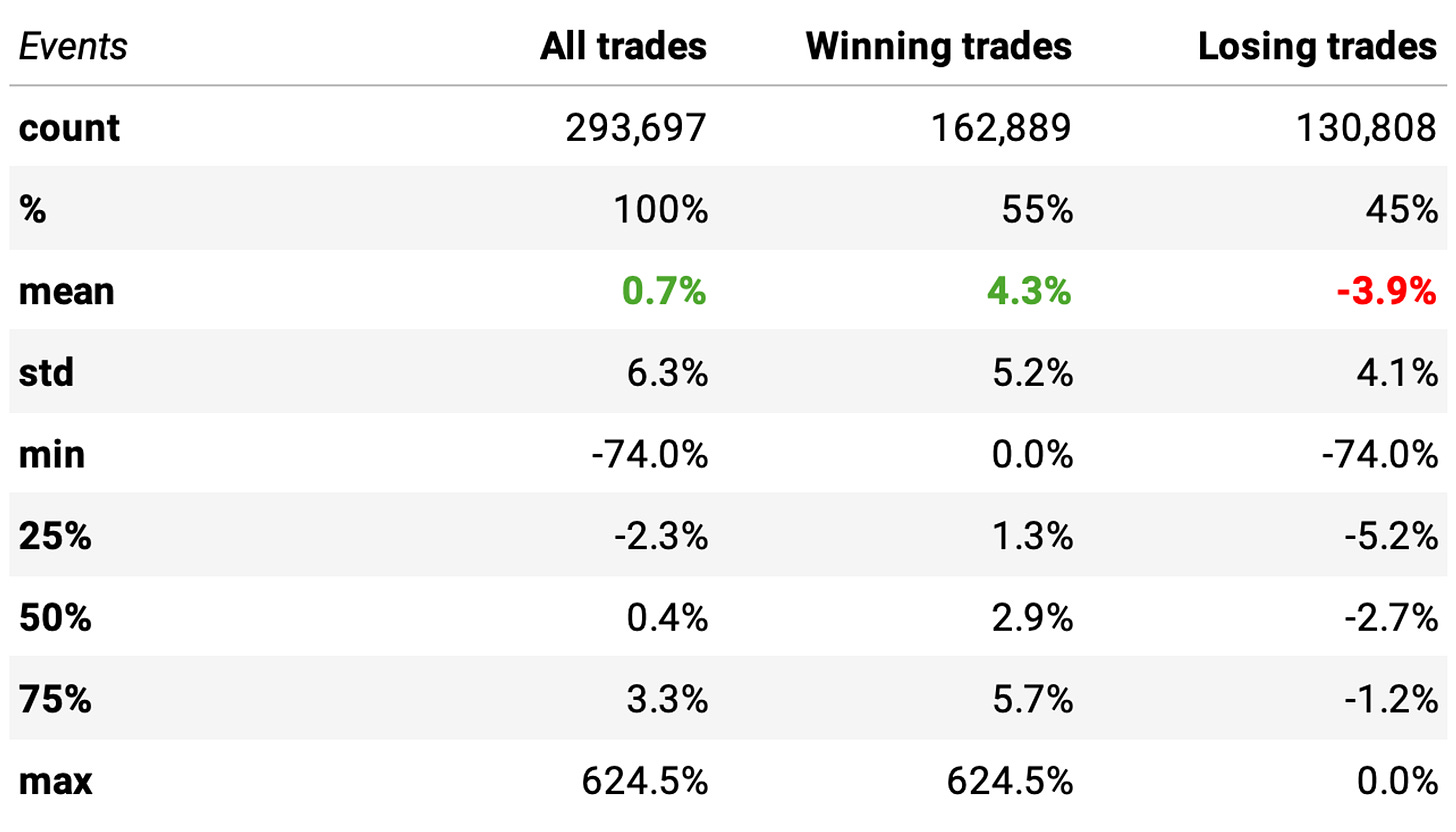
To evaluate the edge, let's check what would have happened if we had bought all opportunities when the 2-period RSI closed below 5 in any Nasdaq-100 constituent throughout history and held it for 5 days:
When we compare these numbers with the general large and mega caps stats we saw in the first article, we already see an interesting difference: the expected return is 0.7% vs. 0.4% large and mega caps in general. Also interesting to highlight:
The win rate is 55%, much better than a coin-flip;
There is a positive payoff ratio: winning trades are expected to generate +4.3% while losing trades -3.9% (4.3/3.9 > 1);
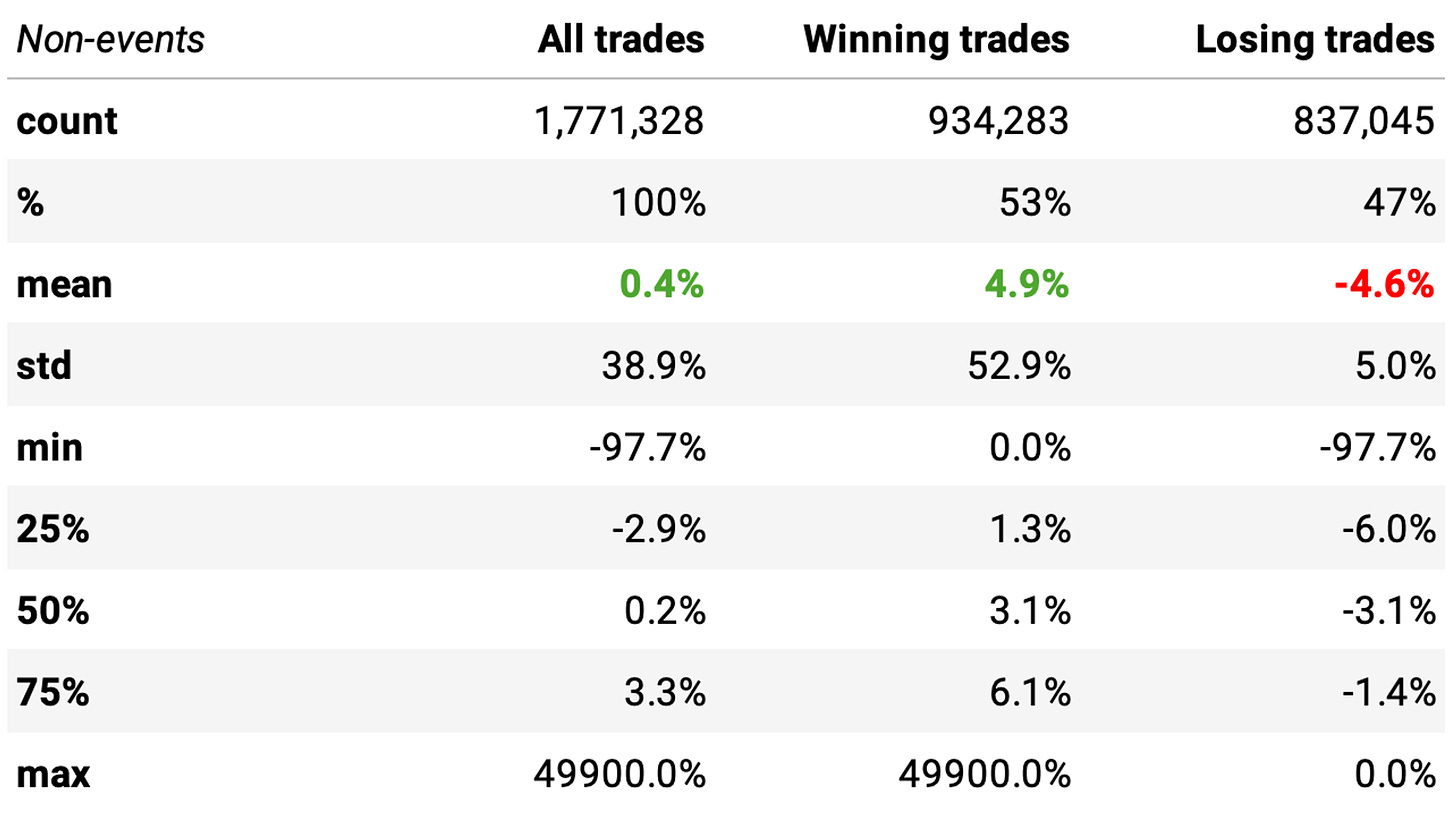
Now, let's compare with non-events: all other instances (when RSI is above 5 or the stock price is below its 200-day SMA):
As expected, we see that the expected return is well below the one obtained with the events. The win ratio is closer to a coin flip, and the payoff ratio is worse (closer to 1).
The P-value is well below 0.05: the means of the two distributions are significantly different. So, we have an edge.
If more than one stock triggers the entry rule on a given day, we must find a way to prioritize them. How?
The impact of volatility
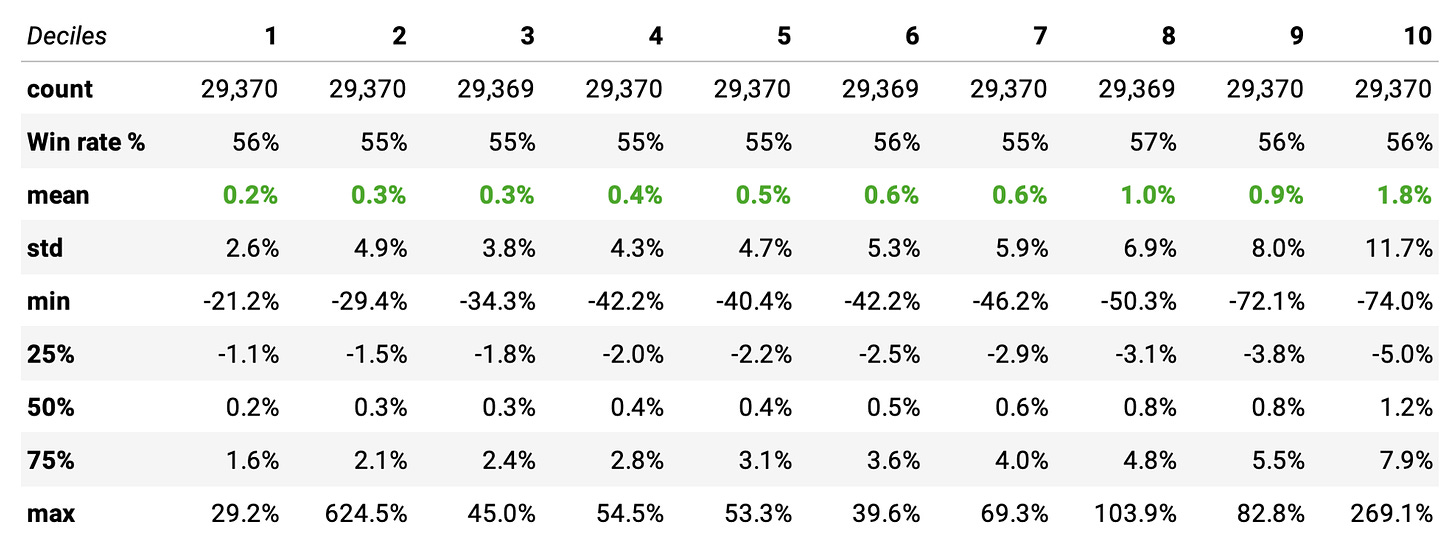
Let's see how this edge varies with respect to volatility, measured as (normalized) Average True Range.
Here, we see that the expected return increases as the Normalized Average True Range increases. This is also expected and makes sense: higher volatility means larger swings.
So, now we have a way to prioritize the opportunities. Let's go ahead and define the strategy in detail.
The strategy
As we did in the previous article, we will trade several instruments in parallel. Here are the rules:
At the opening of every trading session:
We will split our capital into 10 slots and buy stocks whose 2-day RSI from the previous day closed below 5;
If there are more than 10 stocks in the universe with the entry signal triggered, we will sort them by Normalized Average True Range and prioritize the high-volatility stocks;
We will hold 10 positions maximum at any given moment;
When the stock closes above yesterday's high, we will exit on the next open;
We will only trade Nasdaq-100 constituents (at the specific past date).
Important: As we are going to discuss trading costs, the base slippage, and trading costs considered in all experiments are 2 basis points per trade (1 bps in the price against each transaction of the trade). Whenever not specified, this is the cost included in all experiments on the website.
Experiments
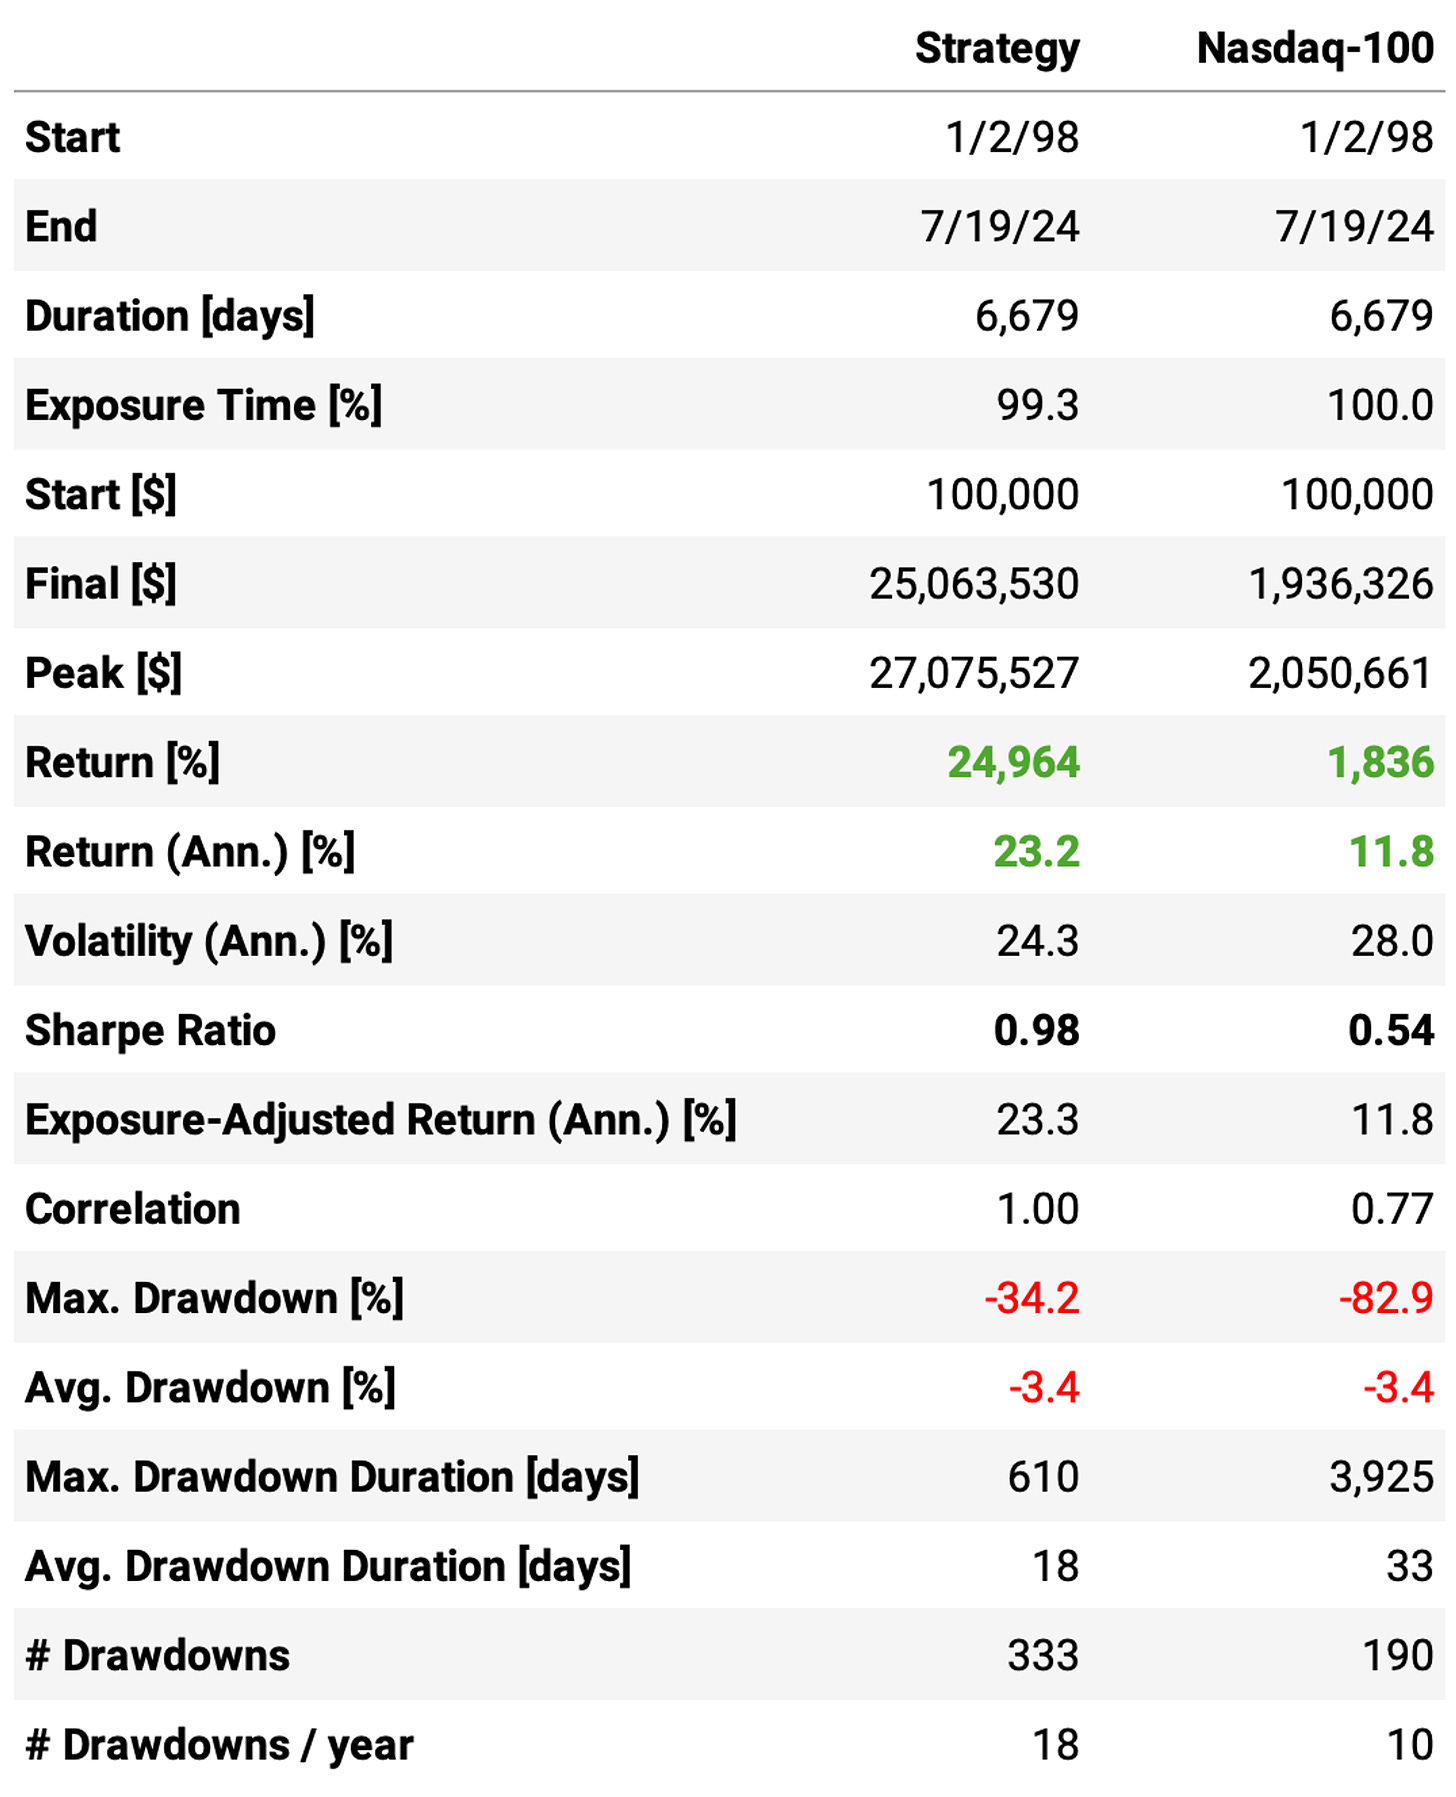
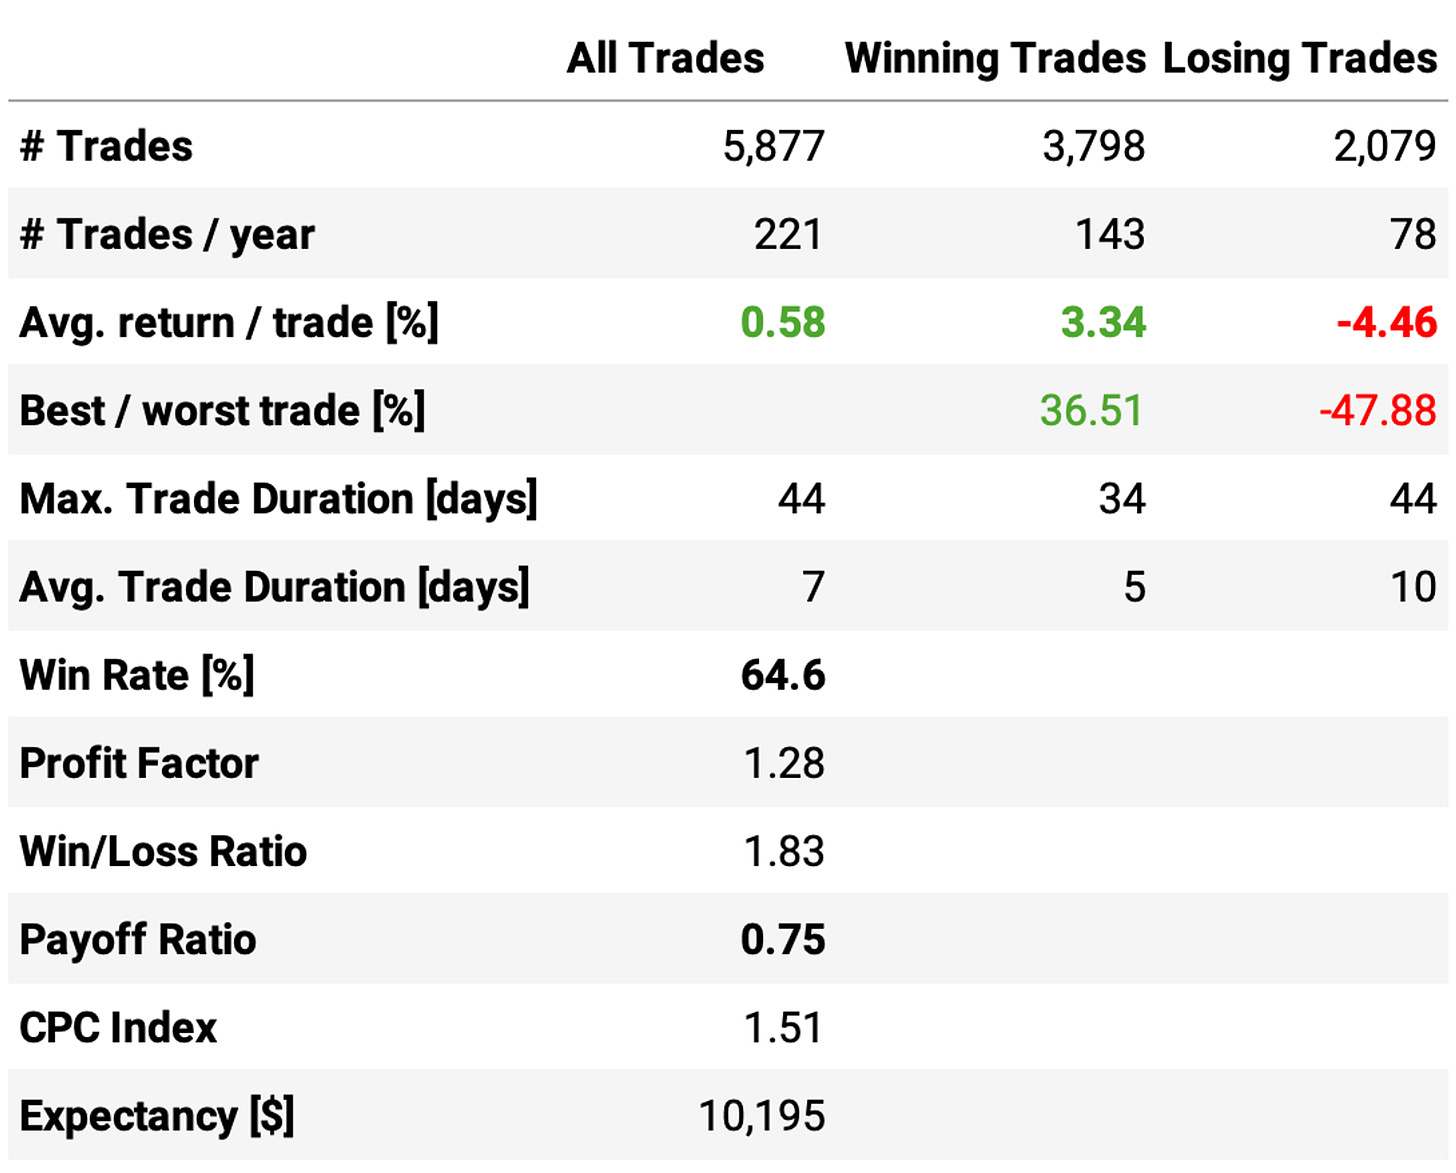
The first experiment tests the strategy as described:
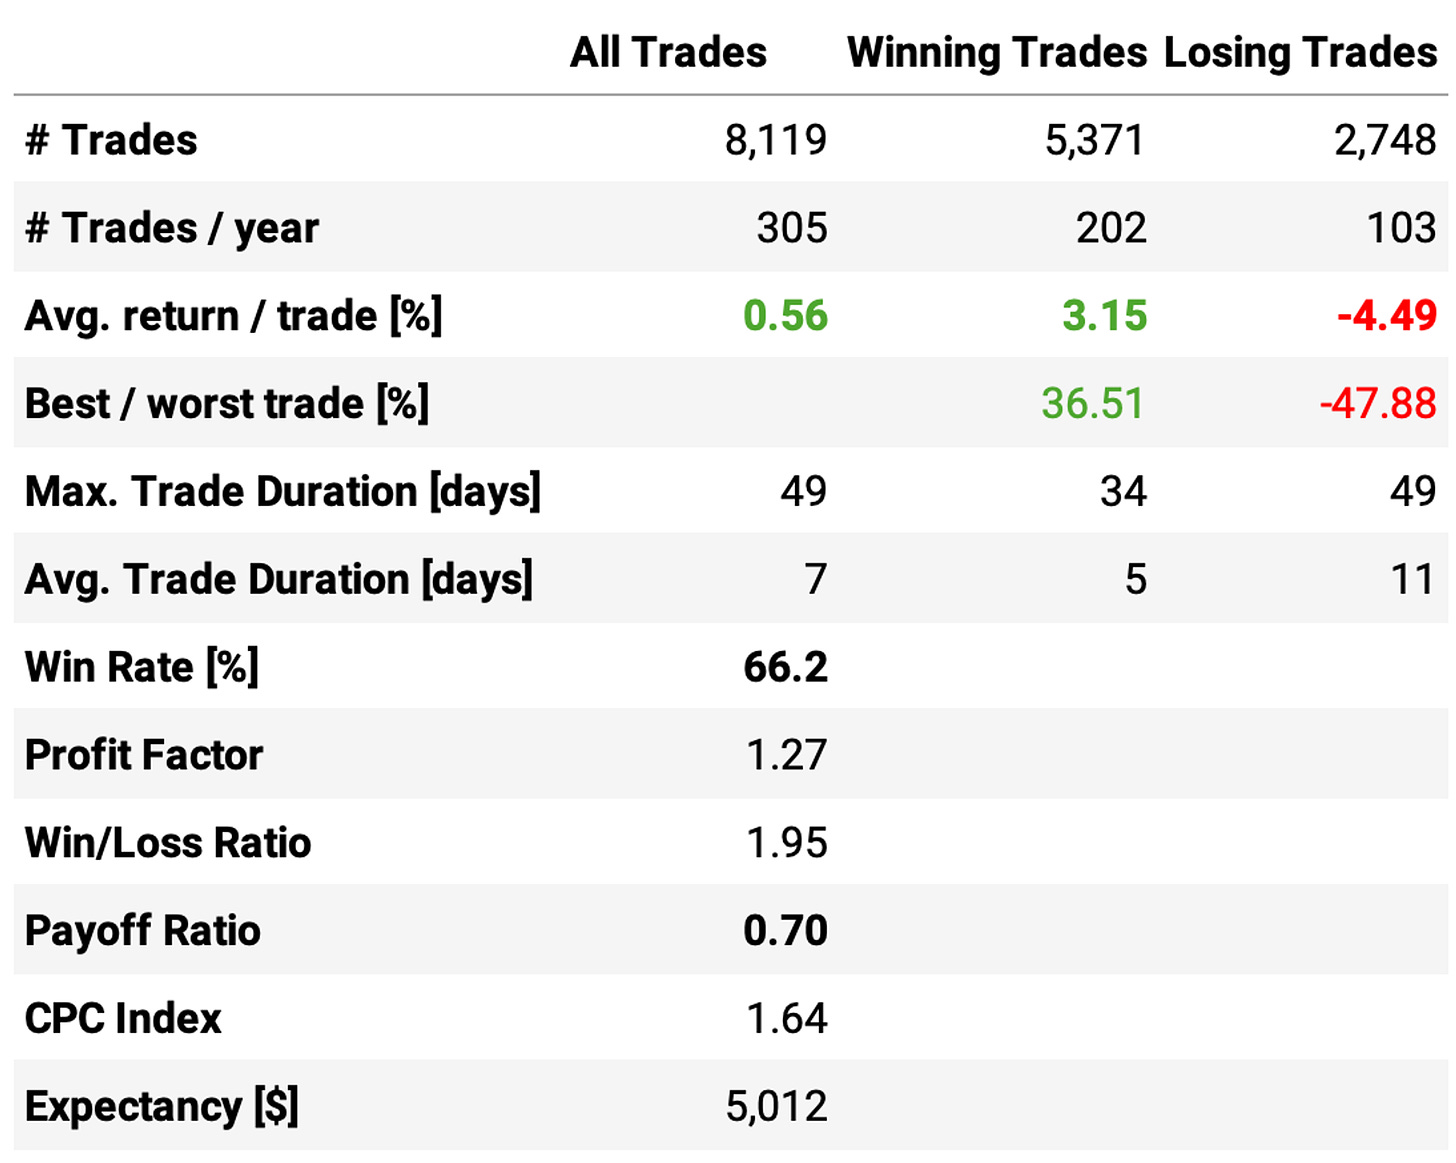
The strategy delivers 23.2% annual returns with a 34.2% maximum drawdown. Sharpe ratio is 0.98. Not bad for such a simple set of rules.
The average return per trade is 0.58%, with a win rate of 64.6%. Looking at the trade statistics, the problem is the payoff ratio of only 0.75: winning trades are expected to deliver +3.3% while losing trades -4.5%.
There's a concerning stat not shown in the tables: the average cash utilization. On average, 20% of the cash sits idle in the account on any given day. That's because not every day can we find 10 opportunities to trade. In fact, on average, we hold 8 stocks on any given day.
Trying different maximum slots
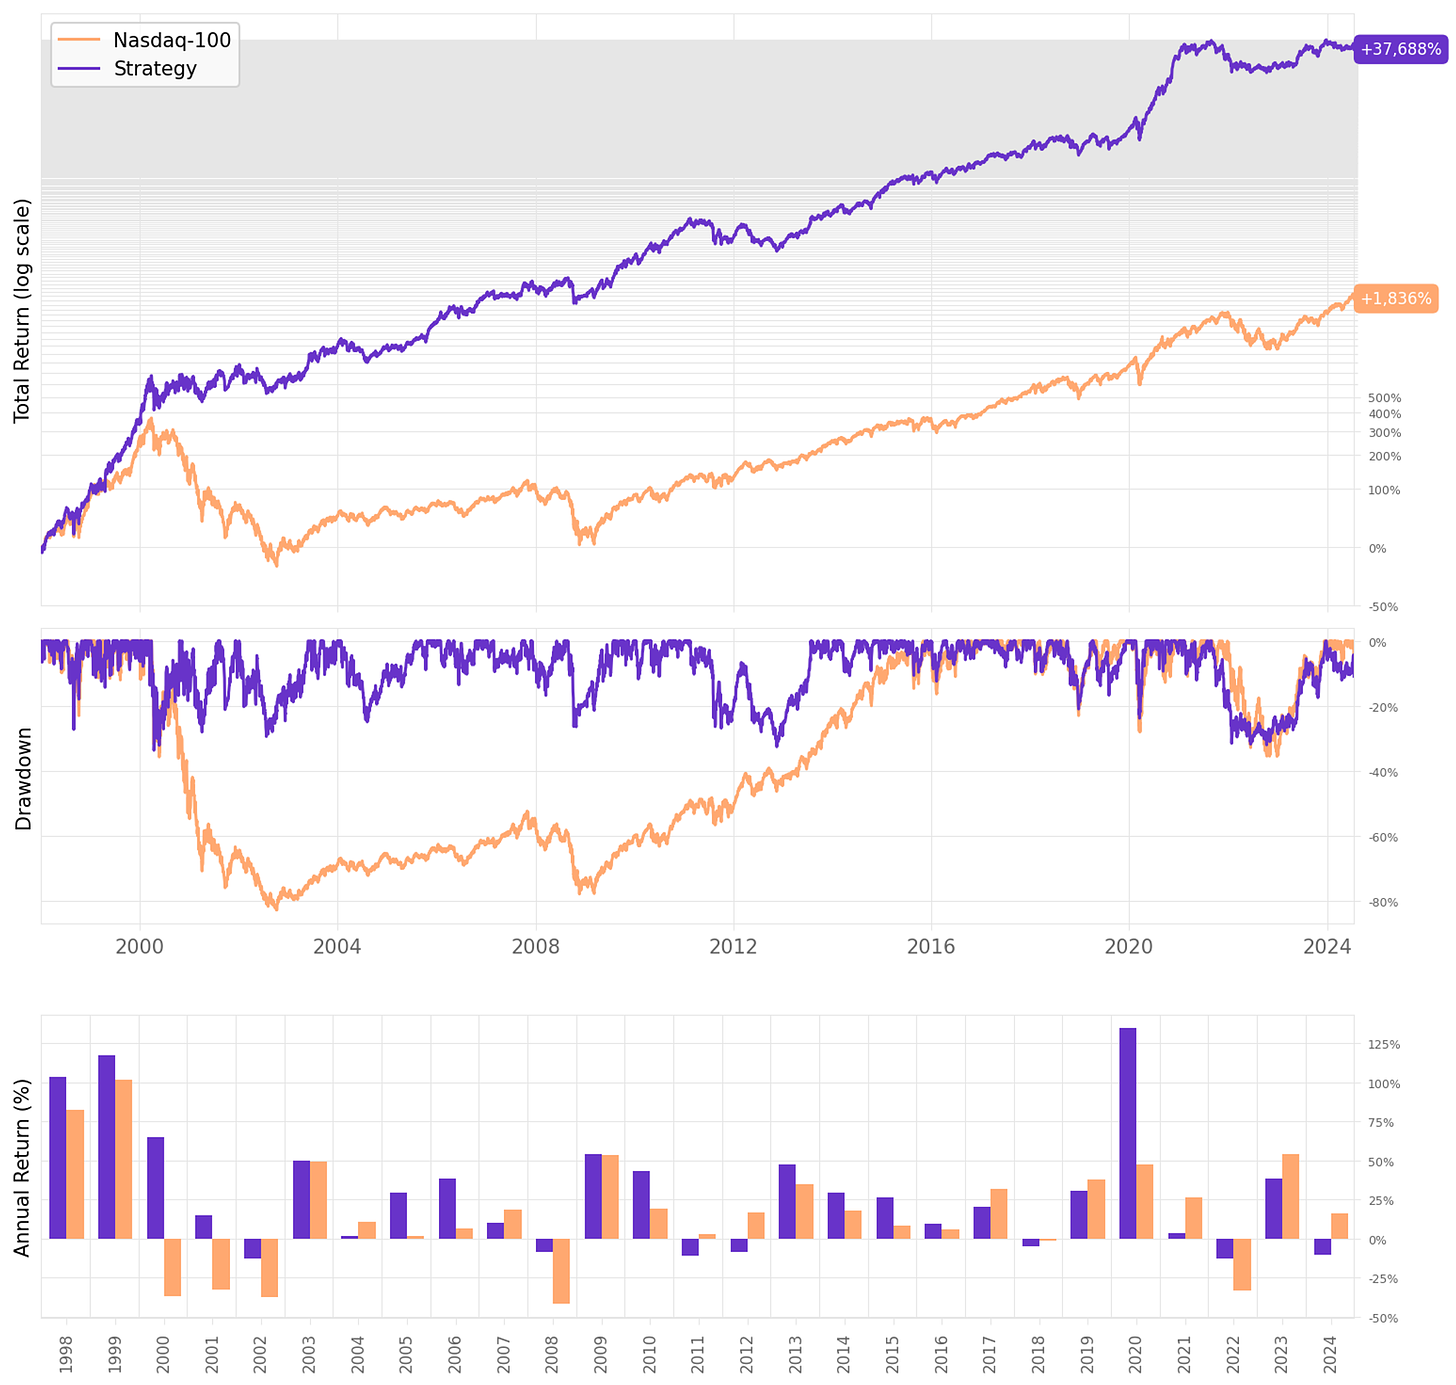
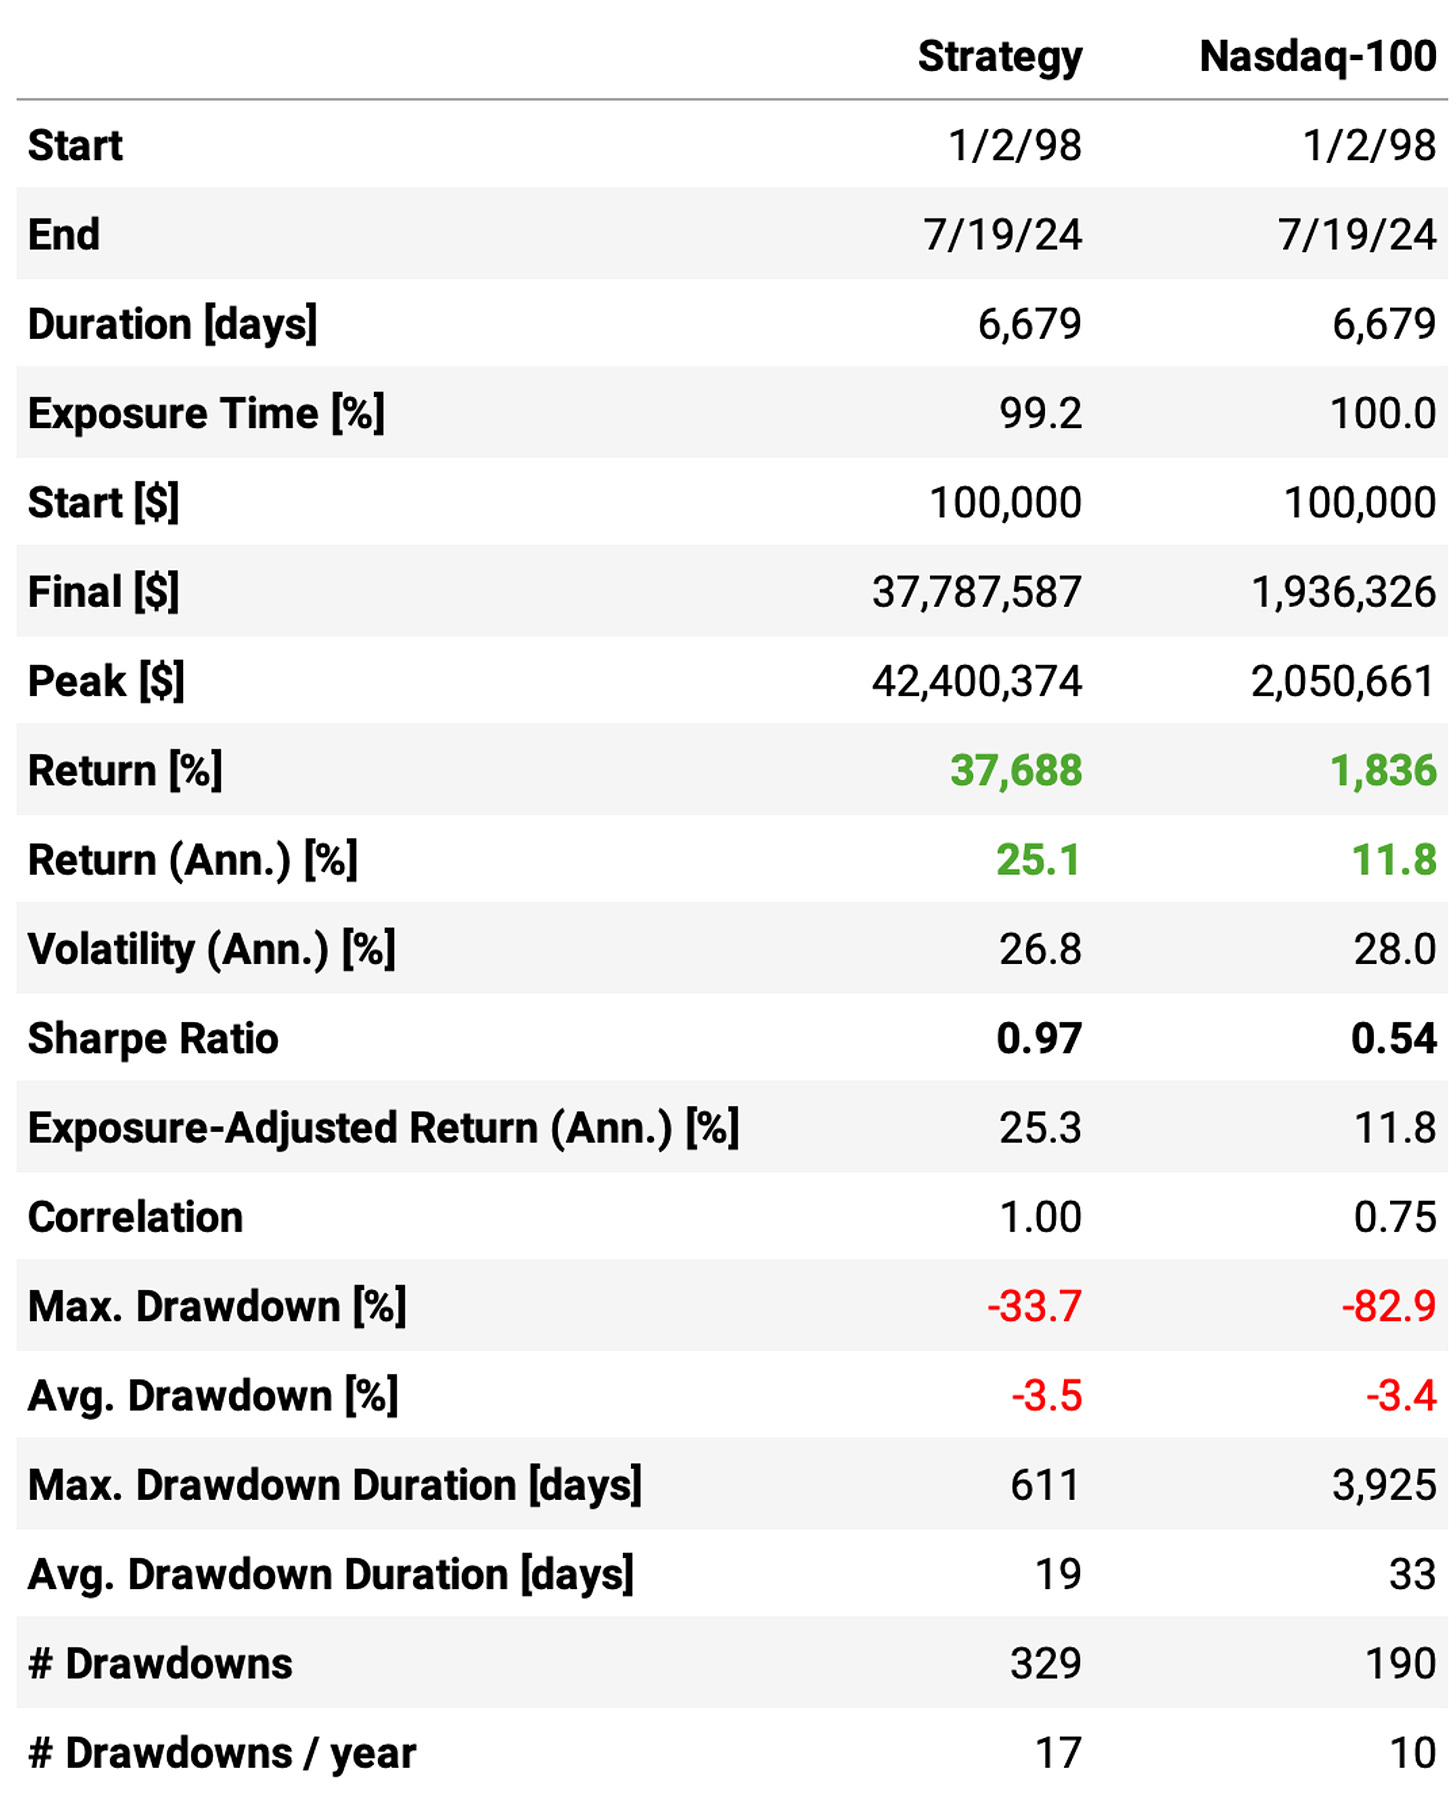
Let's reduce the maximum number of slots to 7 and see how it affects the results:
Here, we can make some interesting observations:
We were able to increase the annual return to 25.1%, +2ppts vs. last run;
The Sharpe ratio remained almost the same at 0.97;
The maximum drawdown also did not change, at 34%;
The average cash utilization improved a bit: on average, now there's 15% of cash sitting idle on any given day.
Let's try a more extreme case, with a maximum number of slots at 4, and see how the numbers change:
Highlights:
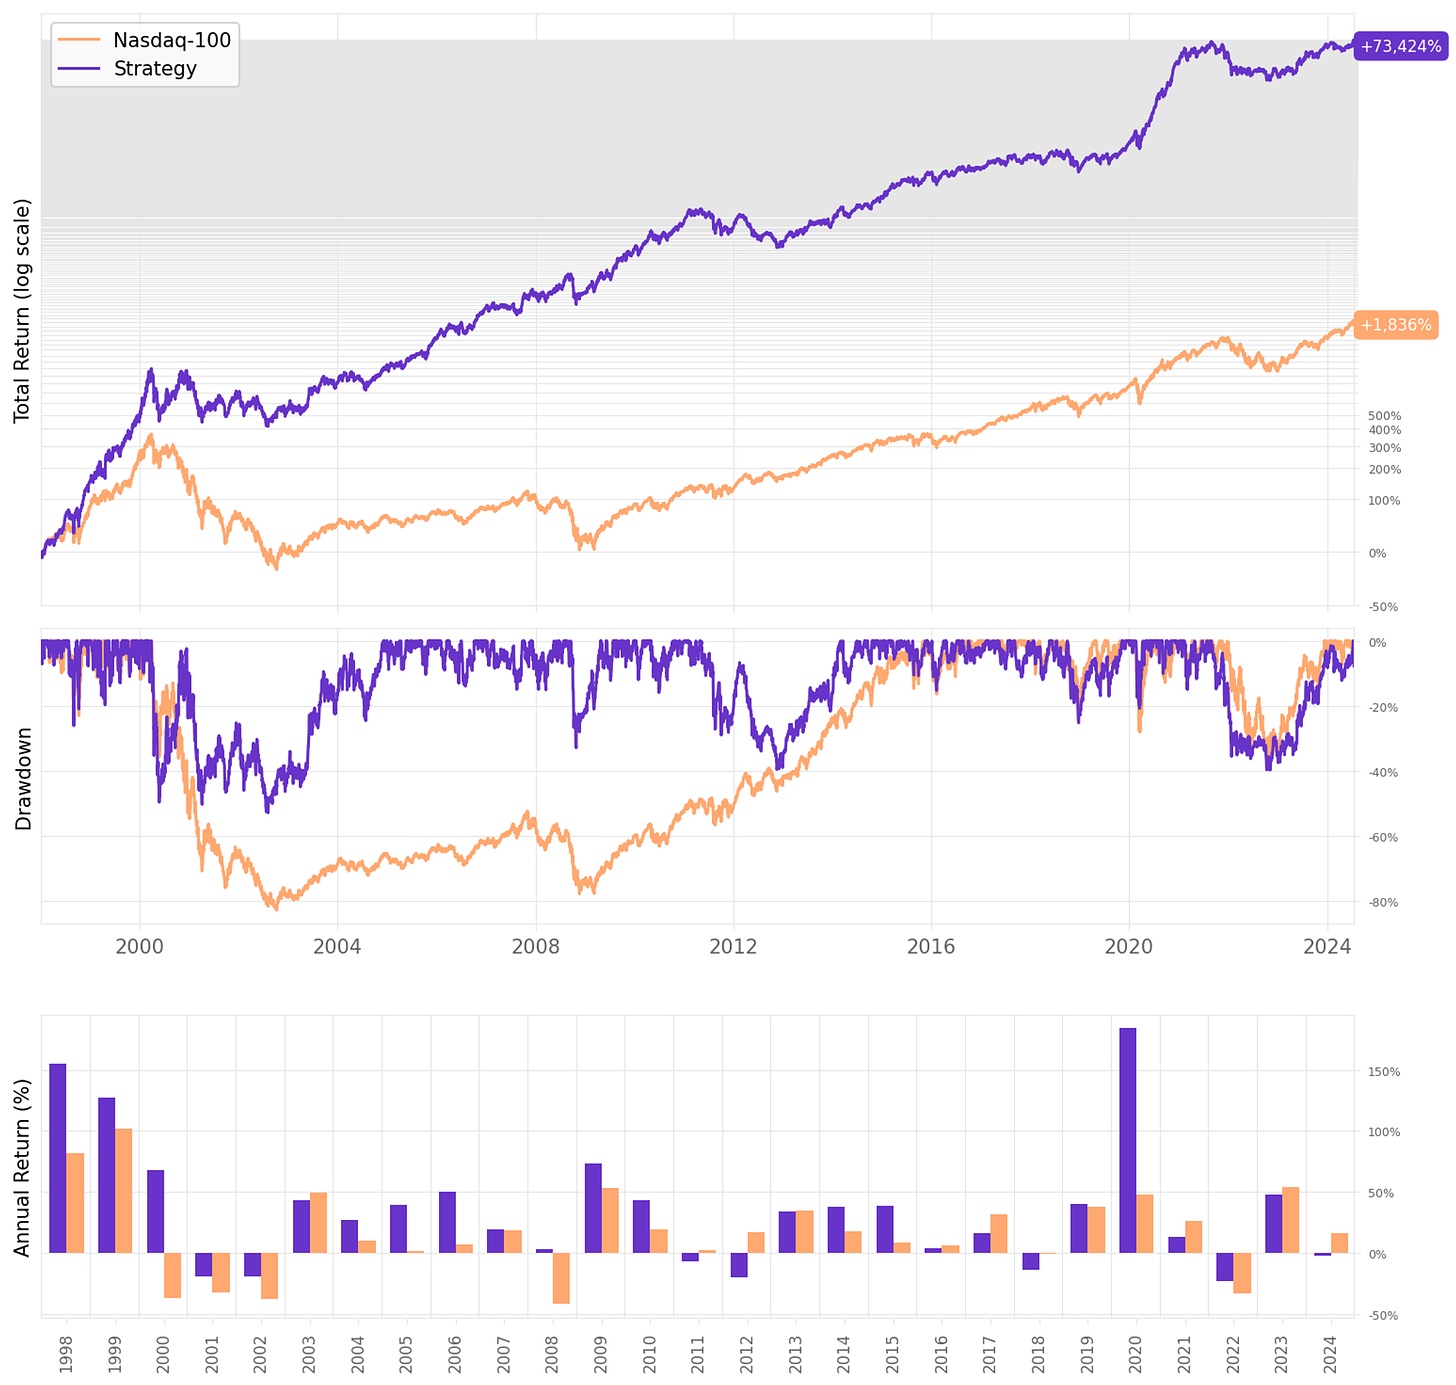
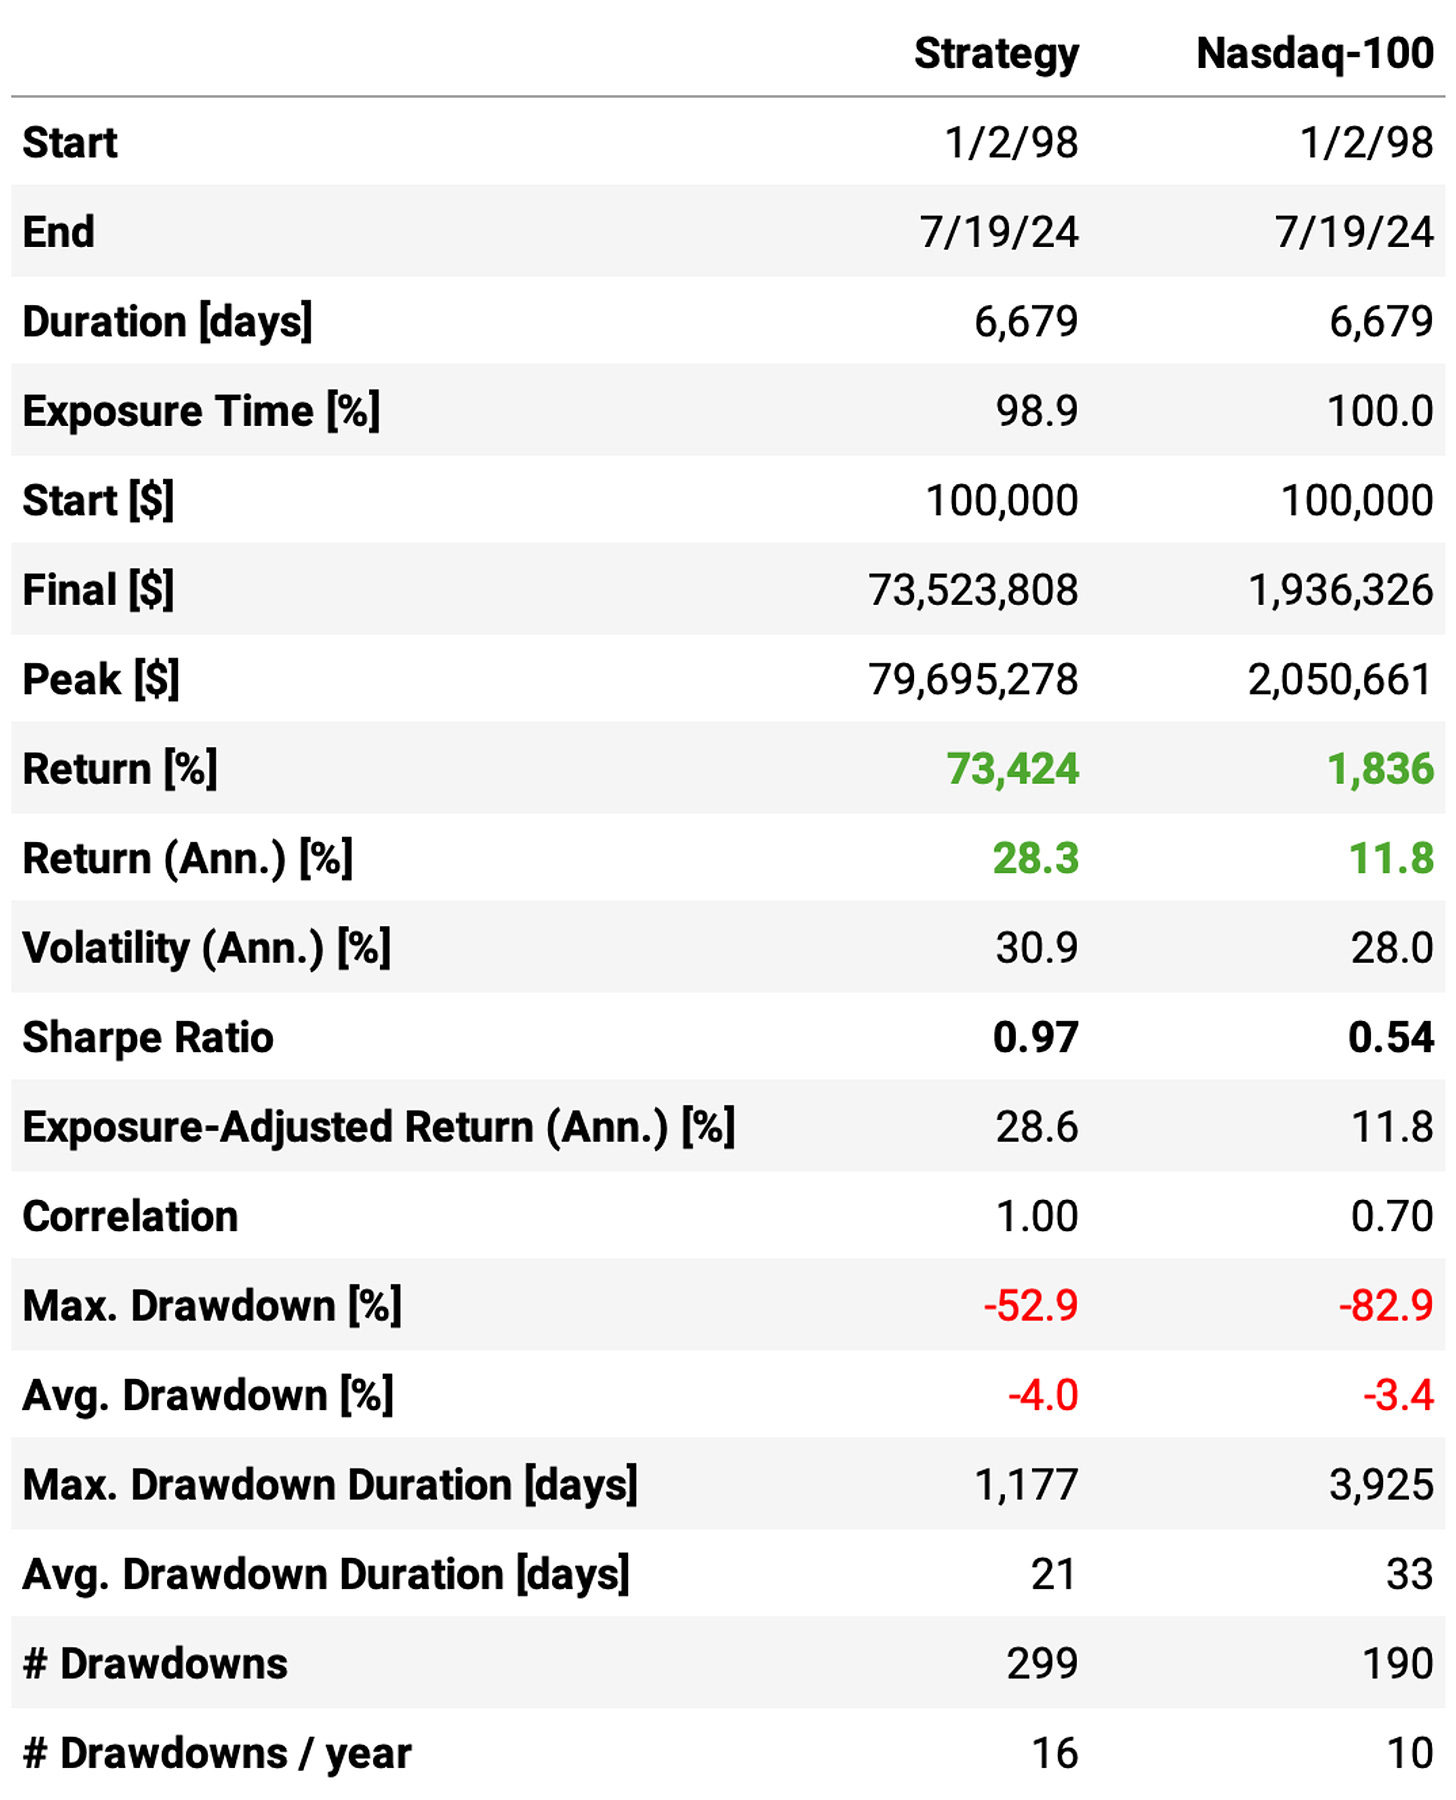
The annual return now reaches 28.3%, +3ppts vs. the previous run;
The Sharpe ratio remains unchanged at 0.97;
However, higher returns come at a cost: the maximum drawdown now reaches 53%, a +19ppts vs. the previous run. This is somehow expected as we are much more concentrated: at any given day, on average, we hold 3 positions, with 24% of cash sitting idle.
After looking at these runs, I started to wonder: can we improve these results by trying a different exit rule?
Trying a new exit rule
Let's replace the existing exit rule with a new one: we exit whenever the RSI crosses above 10. That's it: we will buy whenever a Nasdaq-100 constituent's 2-day RSI closes below 5 and sell when it crosses above 10.
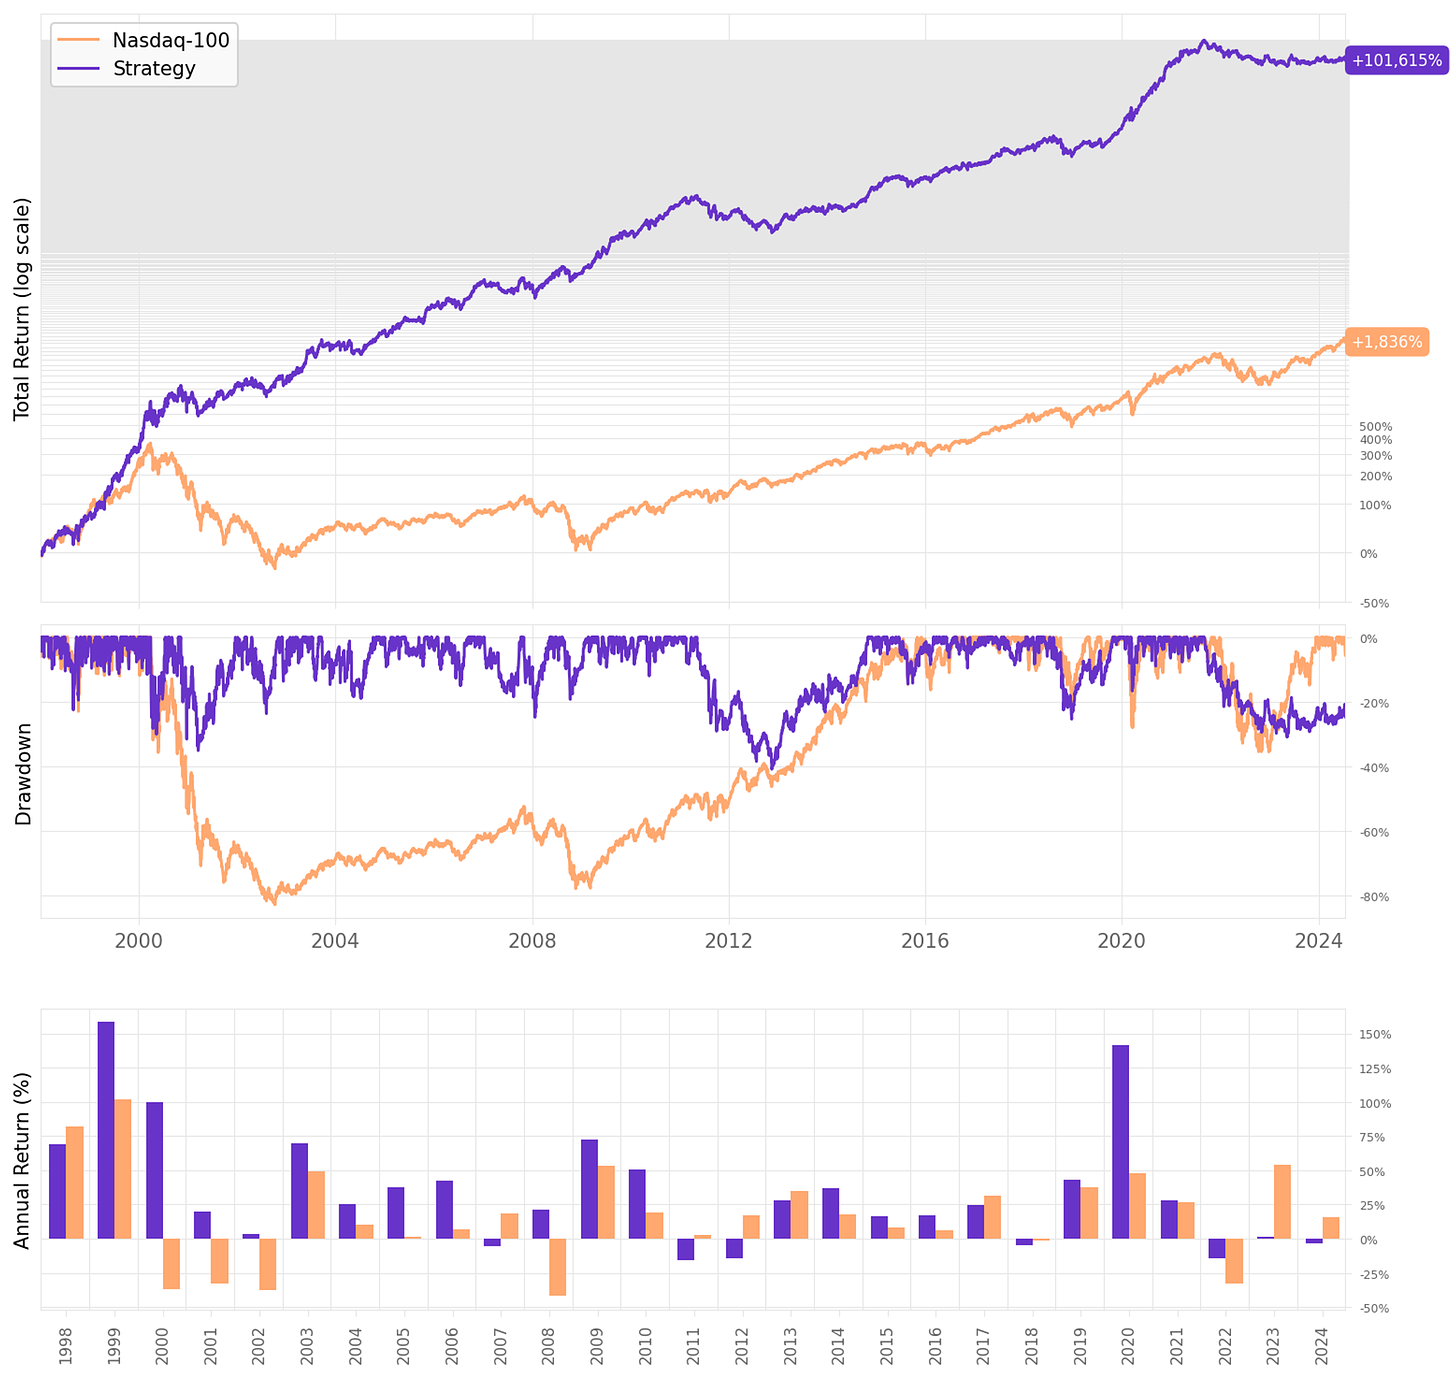
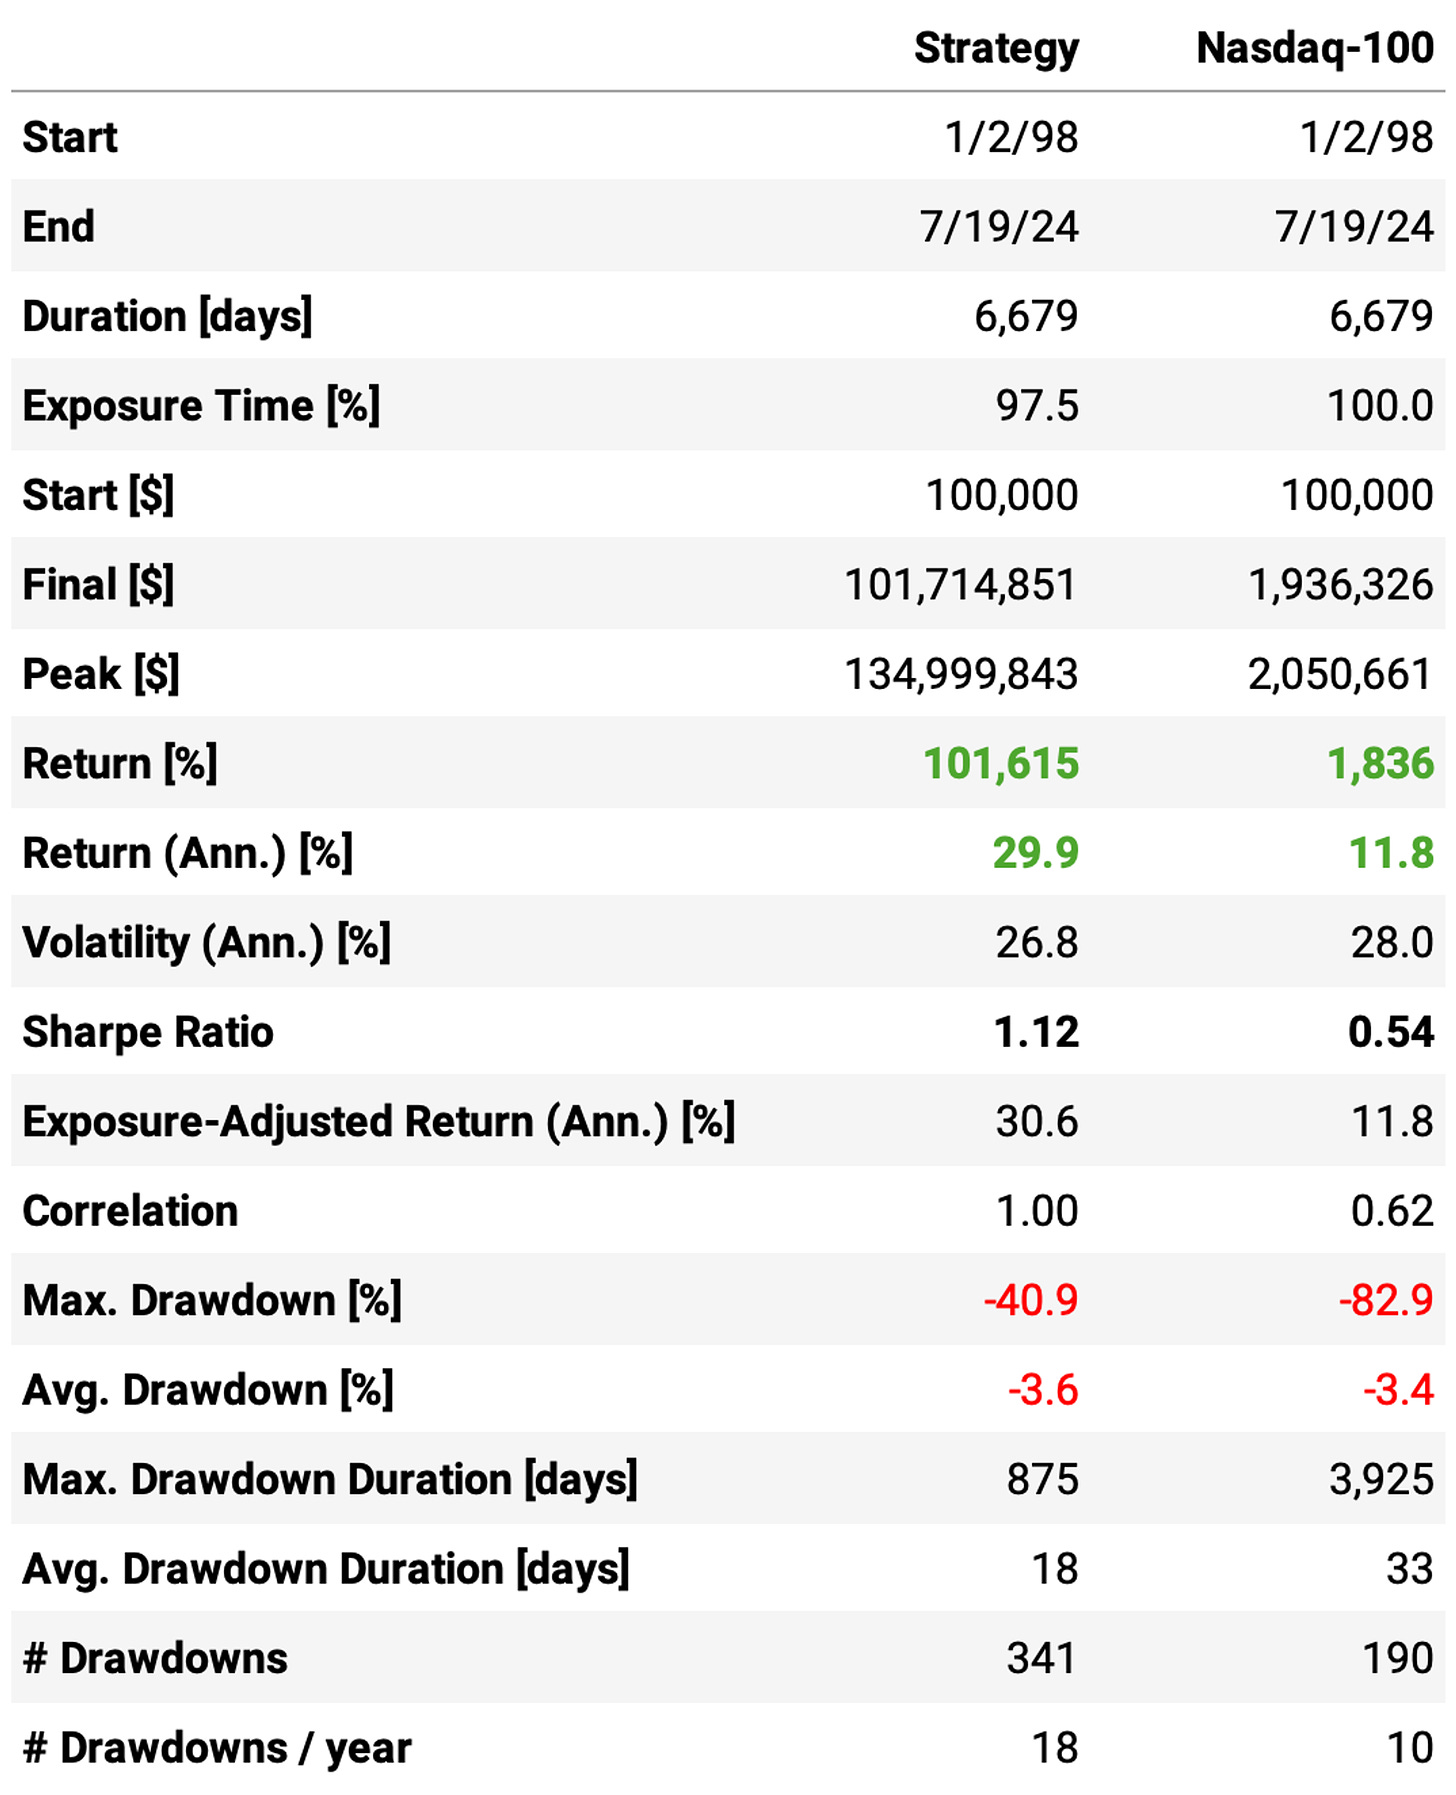
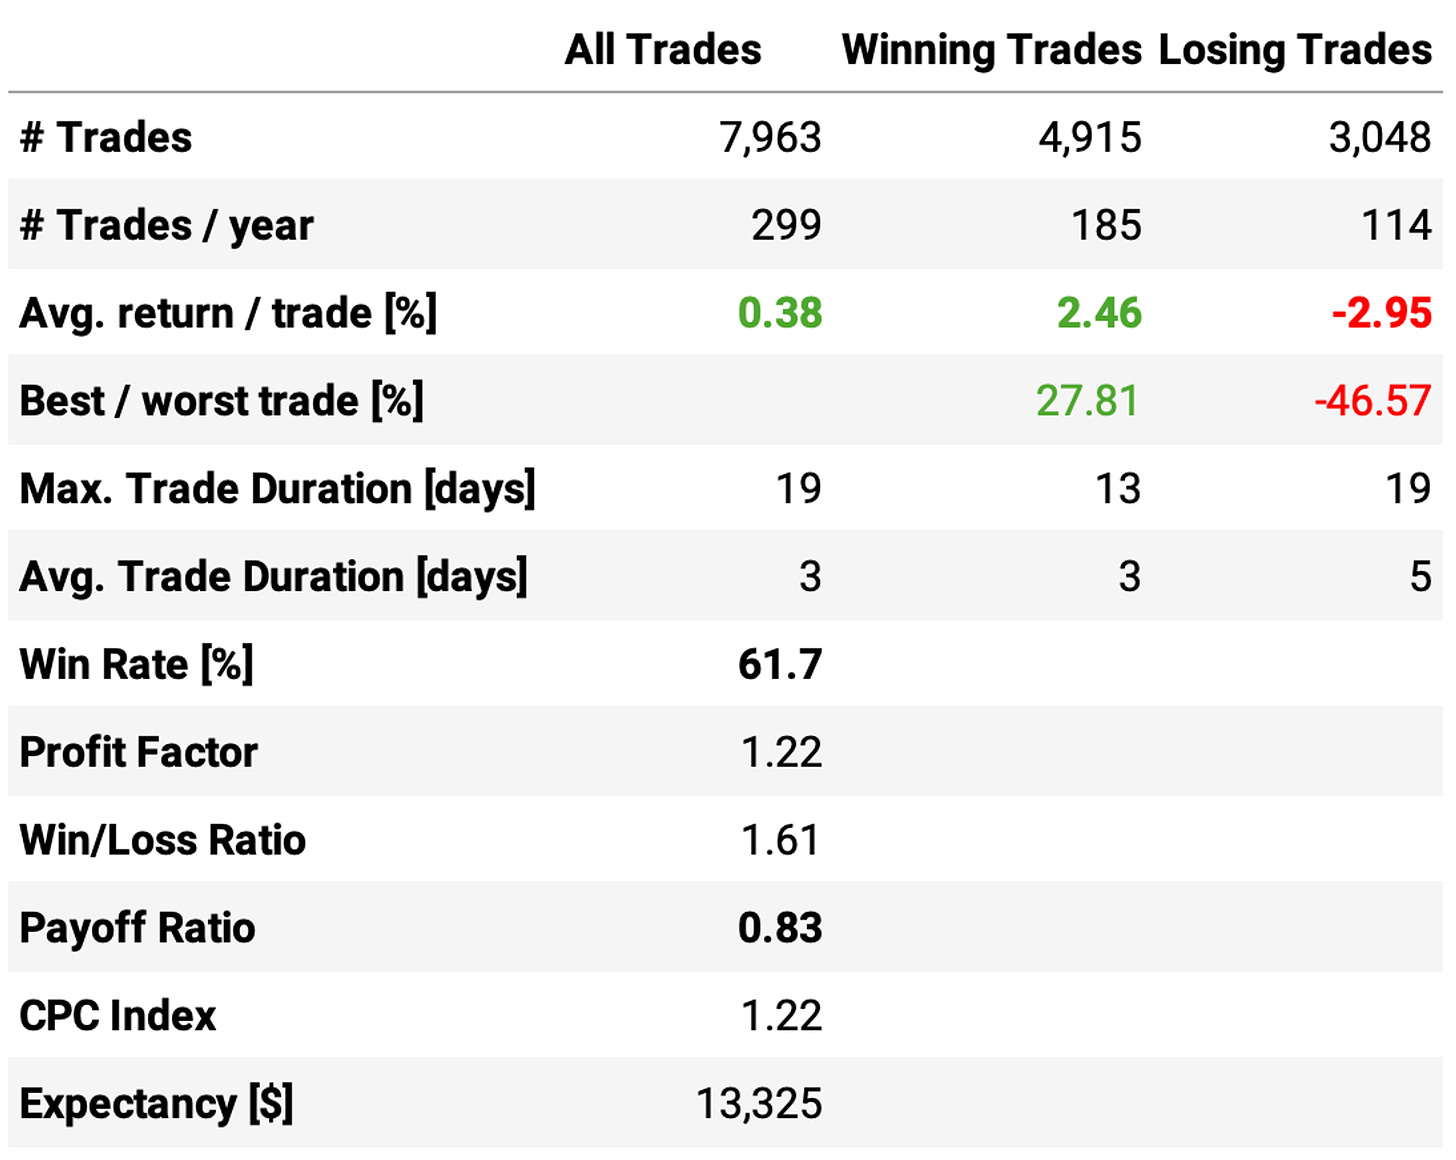
The new exit rule significantly shortened the trades, delivering a better overall result:
The annual return reached 29.9%, a +1.6ppt improvement;
The Sharpe ratio achieved 1.12, another good improvement;
Shorter and more frequent trades also improved the maximum drawdown: it reduced from 53% to 41%;
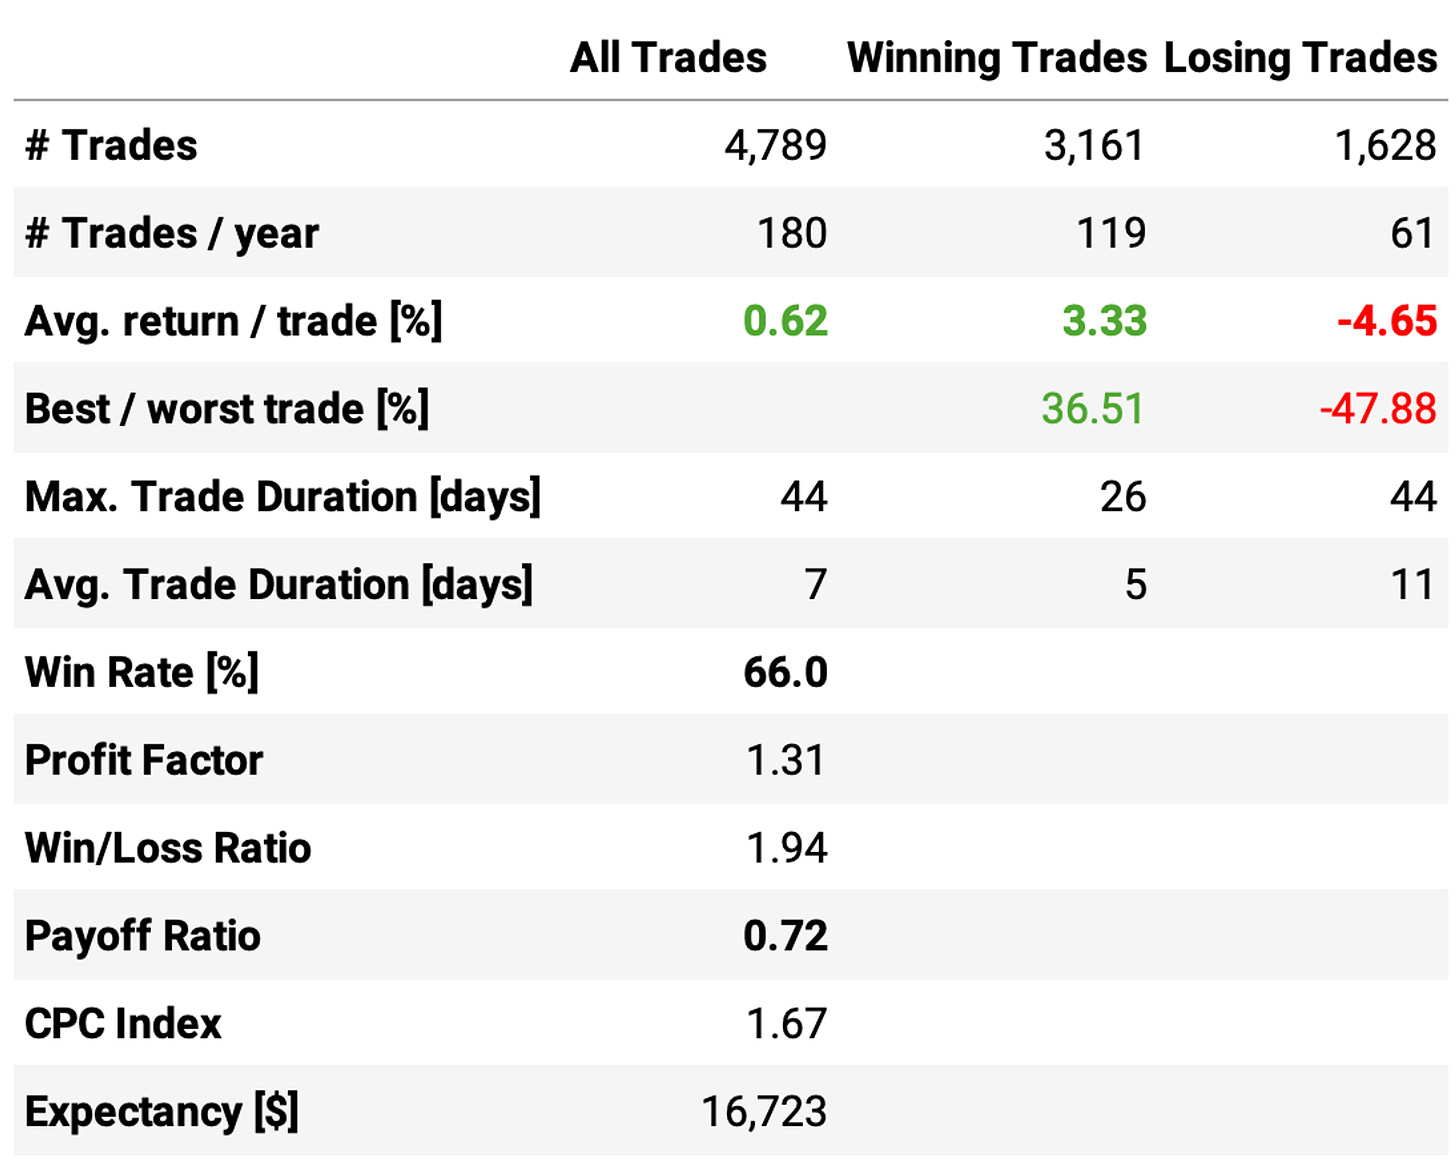
Instead of 180 trades/year at a 66% win rate and +0.62% expected return per trade with a 0.72 payoff ratio, this new exit resulted in 299 trades/year at a 62% win rate and +0.38% expected return per trade with a 0.83 payoff ratio: shorter and more frequent trades improved the overall system.
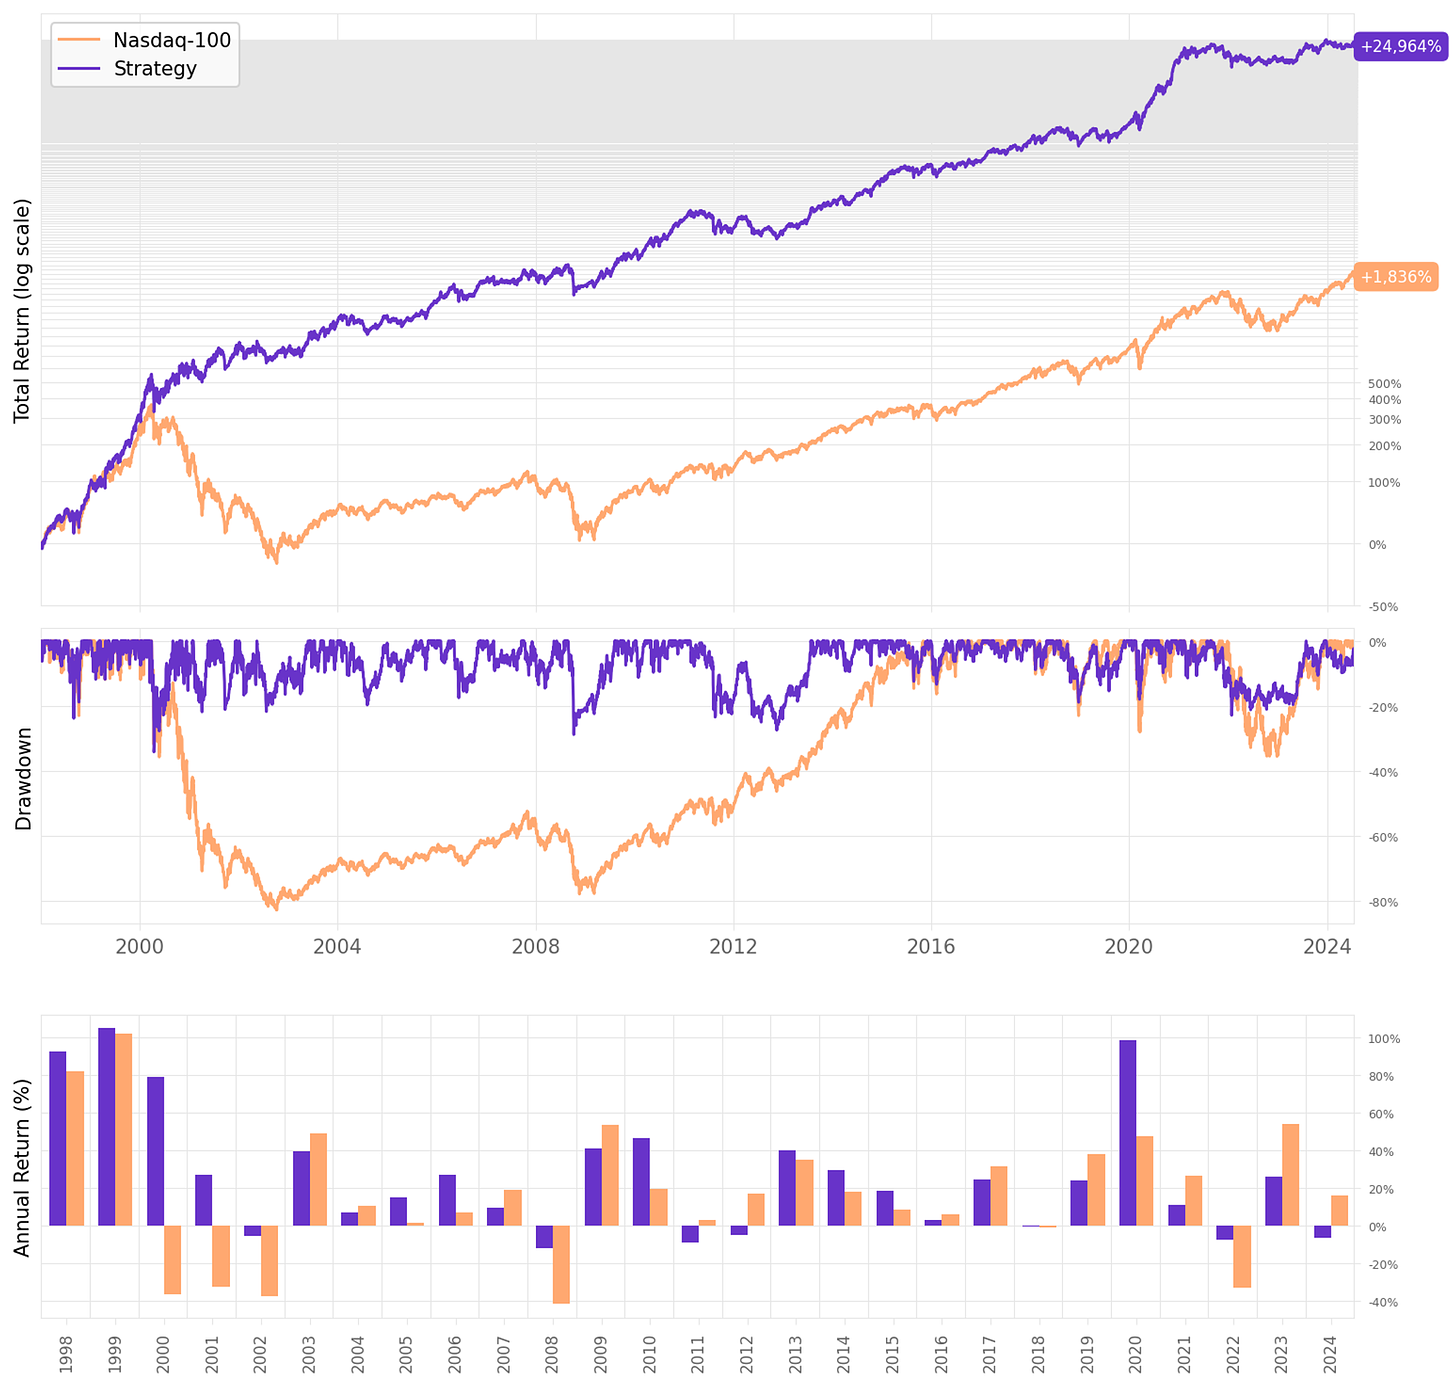
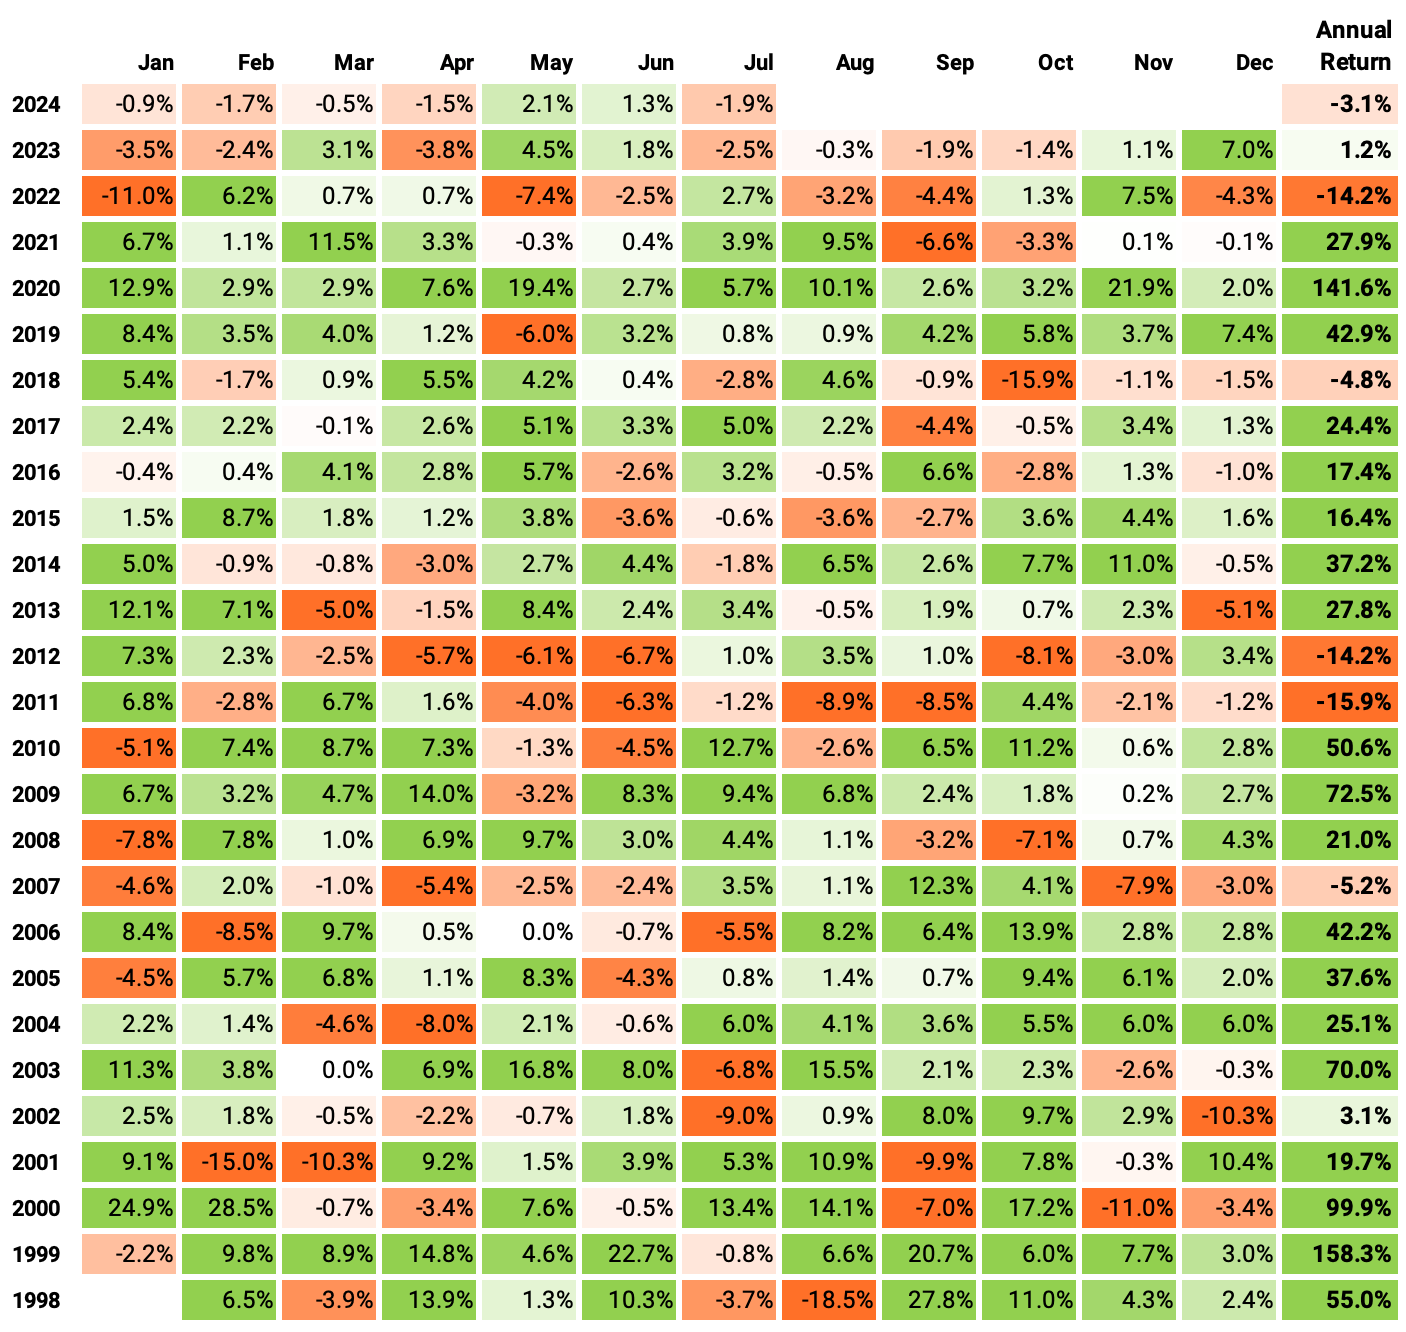
If we had traded this strategy in the last 26 years:
We would have had only 5 down years;
We would have seen 65% of the months positive, with the best at +28.5% (Feb'00);
We would have seen 35% of the months negative, with the worst at -18.5% (Aug'98);
The longest positive streak would have been 23 months, from Jun'19 to Apr'21;
The longest negative streak would have been 5 months, from May'11 to Sep'11.
The impact of slippage + trading costs
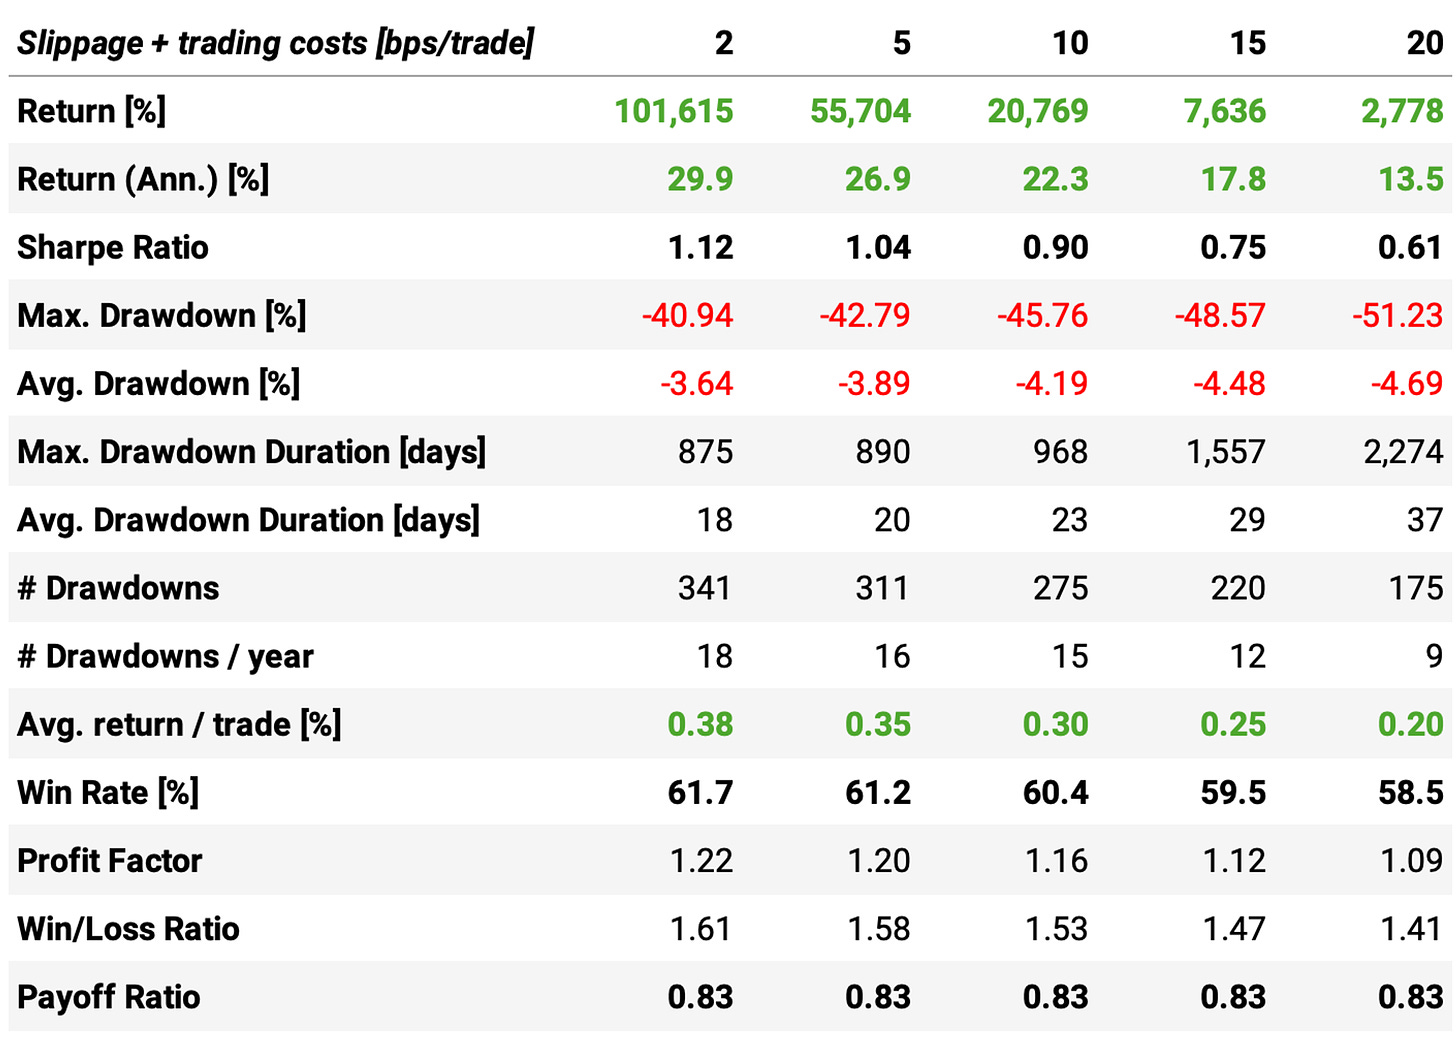
Finally, we show the impact of slippage + trading costs in the key stats:
As expected, the higher the slippage + trading costs, the lower the returns and the higher the drawdowns.
Final thoughts
In some weeks, the article comes out easily. In others, writing the piece requires a ton of work, most of which is not even shown in the final text. This week is an instance of the latter.
Would I trade this strategy as is? Not yet. Drawdowns are still too high. A better question would be: is this strategy closer to being tradable than its first version shared some weeks ago? Definitely.
Some ideas to improve this strategy:
Keep playing with the universe. Try other indices. Again, Norgate Data has 29 different indices with present and past constituents;
Try different entry rules. Instead of using market orders to enter, use limit orders with better limits than the current price;
Experiment with position sizing. So far, we have used the naive equal split among opportunities. Maybe something considering the volatility would be better;
Add a short leg to the strategy. So far, we only traded falling stocks reverting up. Why not also trade rising stocks reverting down?
Whenever I'm writing the final thoughts, I always wonder: there's so much to test, and yet so little time.
As usual, I'd love to hear your thoughts about this approach. If you have any questions or comments, just reach out via Twitter or email.
Also, if you want to implement this strategy (or any other strategy) and need help, just let me know.
Cheers!


If you break the capital into 10 parts on 1st day and get ten signals, isn't all your capital tied up ? So you don't trade on signals from the next day onwards till you get an exit on any position ?
Have you made sure to include de-listed stocks in the universe?
With Norgate there are two separate databases:
'US Equities' and 'US Equities Delisted'
You need to use combination of both databases for initial universe and then do a check to see if the symbol is part of the index at the time.