Momentum-based Long & Short Equities Portfolio
How an old idea can deliver 27.9% annual returns in 24 years
“I can calculate the motion of heavenly bodies but not the madness of people.” Isaac Newton
Sir Isaac Newton, one of the greatest scientists of all time, was also an investor. Newton reportedly invested in the South Sea Company, a British joint-stock company, and initially made substantial profits. However, he reinvested his profits and eventually suffered significant losses when the bubble burst.
This week, we will explore momentum strategies. The basic idea behind momentum trading is that assets that have performed well in the past are likely to continue performing well in the near future, and assets that have performed poorly are likely to continue performing poorly.
The term "momentum" in trading captures the essence of this persistence in price movement. Just as an object with momentum continues in its path until an external force intervenes, an asset exhibiting price momentum is expected to continue its trend until new information or market forces cause a reversal.
Curiously, it was Sir Isaac Newton who formalized the idea of momentum through his laws of motion.
The idea we will explore is pretty simple:
Every month (or week, or 15 days), we will rank a universe of stocks by a momentum factor;
Then, we will long the top decile and short the bottom decile;
At the beginning of every month, we will re-balance.
The study plan we will follow:
First, let's investigate the edge by exploring momentum factors and the difference in returns between the top and bottom deciles;
Then, we will formulate the strategy and experiment with long only, long & short, different position sizing methods, regime filters, etc.;
Finally, we will try to optimize the strategy.
Before we dive into the article, I'd like to invite you to join us in a webinar this week.
On July 11, I will be hosting a live walkthrough of the strategy shared in the article The Edge in Trading IPOs, from Marsten Parker:
I'd like to thank Fawce from Quantopian for inviting me to share the findings with the community. Now, back to the article.
The edge in momentum factors
There are several different momentum factors we could use to rank the stocks in our universe. We will use a classic one: the % price change over the past year up until a month ago, minus the % price change over the past month, normalized by the standard deviation of daily returns from the last year (to ensure we compare apples to apples).
Why did I choose this definition? There is a vast literature documenting momentum factors, and this one is proven to work.
Now, we want a factor to have a strong predictive power of future returns. To analyze that, we:
Compute the factor for every stock in the universe for every day since 1999;
Compute the future returns for every stock for different timeframes (1 week, 2 weeks, and 1 month);
Assign the factor decile to each stock every day;
Aggregate by decile and annualize the 1-week (5 days), 2-week (10 days), and 1-month (21 days) returns (again, to compare apples to apples).
For the universe, we select the top N stocks in terms of market cap every single day (we check different values for N).
Here's what we found:

This is exactly what we expected:
The high-momentum stocks (10th decile) show the highest returns
The low-momentum stocks (1st decile) show the lowest (negative) returns
This is what we need to create a long-short portfolio
Let's see what happens when we increase the universe (N = 500):
We continue to see the expected behavior. Now, there's a subtle difference worth noting: all returns are higher when compared to the previous smaller universe. That's probably because of diversification (in a 500-stock universe, every decile has 50 stocks instead of the previous 15).
We can see a final example with N = 2,000:
Again, as expected, the momentum factor we've chosen works. And we can conclude that the larger the universe, the higher the returns in each decile.
Experiments
Long only
We start by showing a long-only version of the strategy, with monthly rebalance:
On the first day of every month, we rank the top 150 stocks in terms of market cap according to their momentum factor;
We long the top 15, with equal weights to each stock.
Here are the results:
I find it impressive that such a simple strategy can outperform the S&P 500. The long-only version delivers an 11.7% annual return since 2001, almost 2x the benchmark. Let's see the long & short now.
Long & short
These are the rules for the long & short:
On the first day of every month, we rank the top 150 stocks in terms of market cap according to their momentum factor;
We long the top 15 and short the bottom 15, with equal weights to each stock;
We use all the available capital (the cash available and the proceeds from the shorts) to long the stocks.
Here are the results:
Using long & shorts significantly improves the results. Highlights:
The strategy achieves a 22.5% annual return, almost 4x the benchmark and 2x the long-only version;
The risk-adjusted return is better than the benchmark: the strategy has a 0.74 Sharpe vs. 0.41 the S&P 500;
However, the maximum drawdown is too high at 70%;
The strategy is positive in 63% of the months and in 20 of the 24 years;
The average monthly return is 2.1% (6.9% in positive months vs. -6.2% in negative months).
The maximum drawdown, achieved during the 2008 financial crisis, is too much. Let's keep exploring.
Exploring different universes and rebalancing frequencies
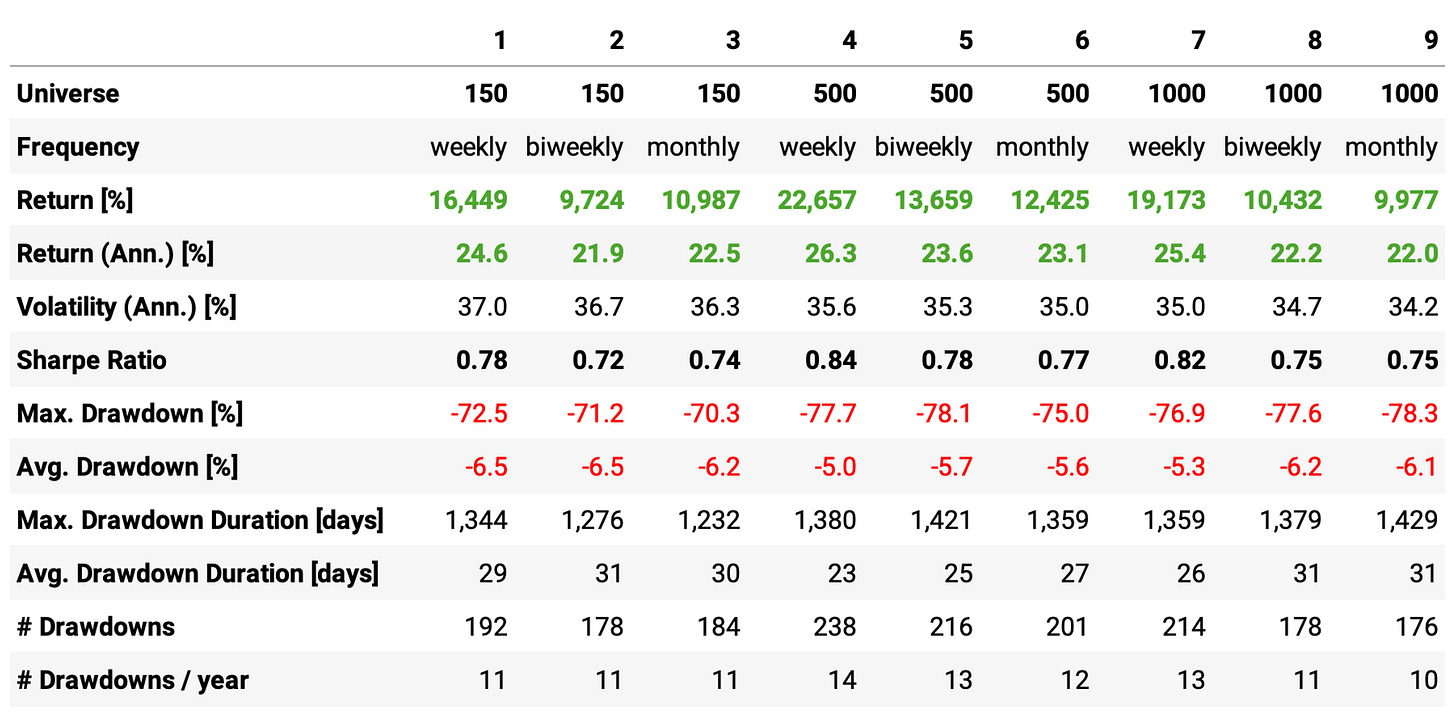
Now, we ask ourselves: how would the strategy behave if we considered different universes and rebalancing frequencies? Let's check the following 9 experiments:
Universes: top 150, 500, and 1,000 stocks in terms of market cap;
Rebalancing frequencies: weekly, biweekly, and monthly.
Here are the results:
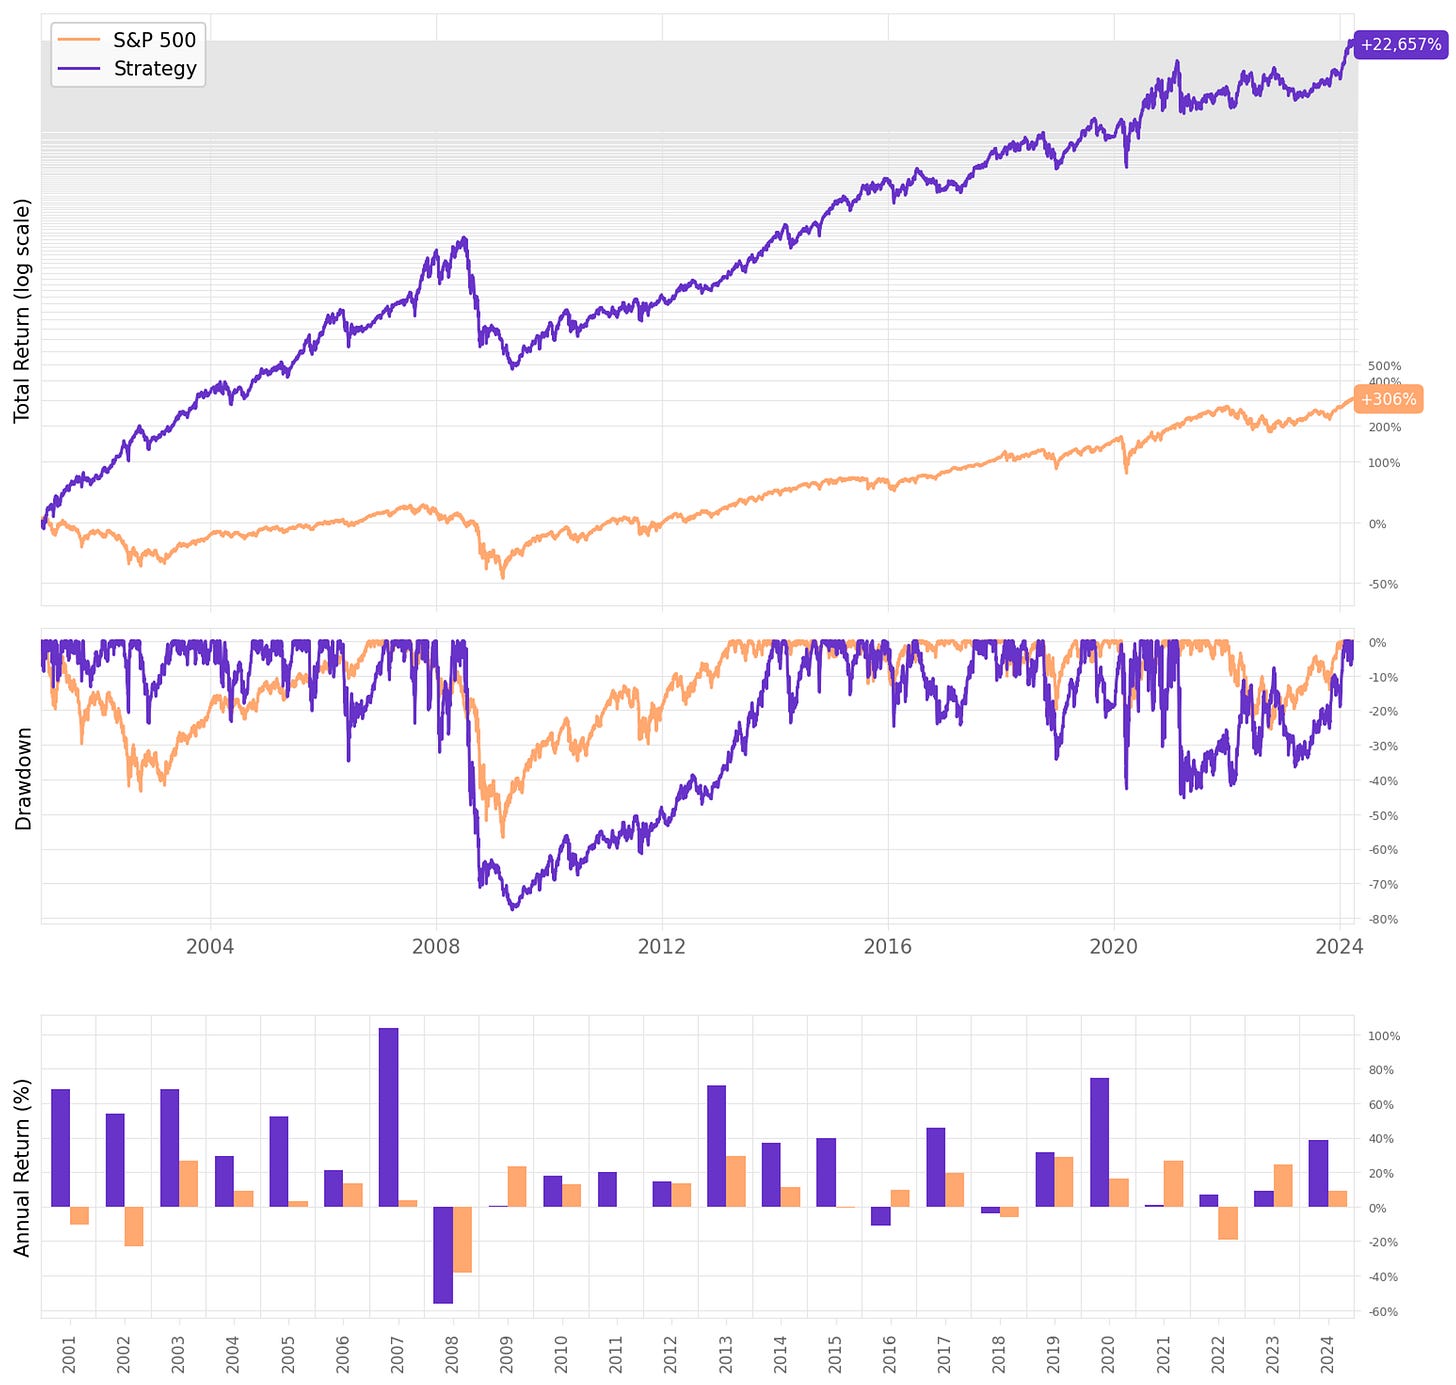
We see that the best performance is achieved in experiment 4, with a universe of 500 stocks and weekly rebalancing.
Here are the details of this specific combination:

This is a nice improvement vs. the previous results:
The annual return reaches 26.2%, +4ppts vs. the previous run;
We get a 0.84 Sharpe ratio, also improving the risk-adjusted return;
However, the drawdown continues pretty high at 78%.
What can we do to try to reduce these drawdowns?
Position sizing
My first thought was to play with stop-loss orders. I couldn't manage to make them work: whenever I tried them, they would significantly reduce the total return, throwing the baby out with the bathwater.
Next, I tried position sizing. So far, we have been equally distributing the available capital amongst all longs and shorts. Now, this is what we tried:
Instead of distributing the capital equally, we do it proportionally to the momentum factor;
If, on a given rebalancing date, there are longs (shorts) with negative (positive) momentum factors, we do not allocate capital to them (this capital sits in cash for the period).
Applying this smarter position sizing mechanic led to the following results:

We managed to get an even higher annual return (27.9%). There are 6 out of 24 years with returns above 50%. However, the maximum drawdown now reached 80% during the 2008 financial crisis. The strategy is still too risky for my (and most people's) taste.
Market regime filter
Our final attempt to tame these drawdowns is applying a market regime filter:
If, on a rebalancing date, the S&P 500 is below its 200-day moving average, we move to 100% cash;
We resume trading when the S&P 500 comes back above to the 200-SMA.
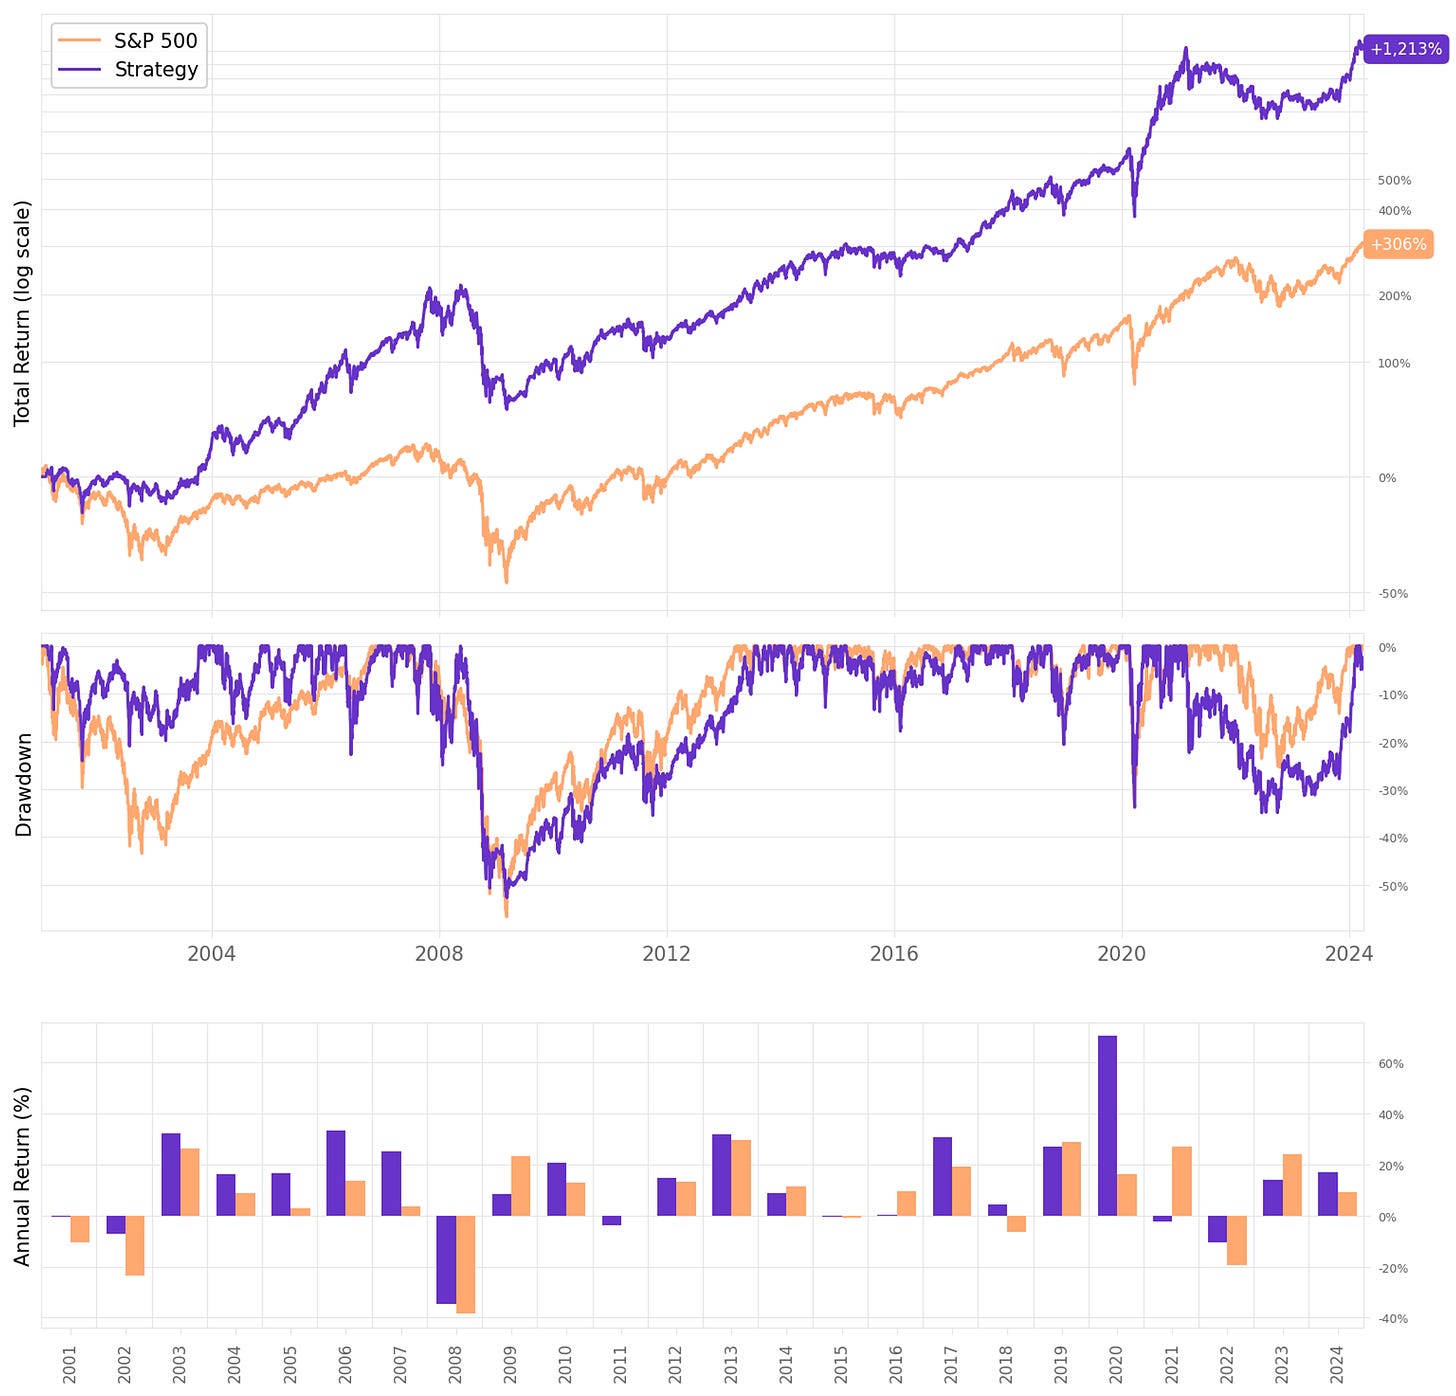
Here's how the filter impacts the results:
Applying the market filter significantly improved the risk-adjusted returns:
We achieved a 0.91 Sharpe, the highest in all experiments;
The maximum drawdown reduced to 57%, same as benchmark, and unfortunately still too high;
Now, we were invested 80% of the time: the exposure-adjusted return would be 23.4%.
Final thoughts
Momentum, the tendency of past winner stocks to outperform past loser stocks over the next several months, is one of the most well-documented and well-researched asset pricing anomalies. Naturally, it's good to have momentum strategies in our portfolio.
Would I trade this strategy as it is? No. Drawdowns are still too high. There are several ways in which we could try to reduce the risk of this strategy:
We could try looking at individual stocks and not a portfolio; then, we could trade instruments in parallel as opportunities appear (as we did with some mean reversion strategies);
We could try different asset classes (ETFs, futures, crypto, etc);
We could try a cross-sectional momentum strategy;
We could try a machine learning model to predict the probability of a stock to outperform (or underperform) in the near future, training this model with momentum-based signals.
But next week, I think I will write about a portfolio of strategies: how would a combination of a mean reversion and a momentum trading strategy improve the overall results? It's a good question to answer.
As usual, I'd love to hear your thoughts about this approach. If you have any questions or comments, just reach out via Twitter or email.
Also, if you want to implement this strategy (or any other strategy) and need help, just let me know.
Cheers!


tcost?
Eagerly waiting for the combination of mean reversion and momentum strategies