Informational Edge
Turning news sentiment data into a +2 Sharpe market-neutral strategy


The idea
“We don't have better algorithms; we just have more data.” Peter Norvig.
Peter Norvig is one of the greatest computer scientists of all time and a leading figure in artificial intelligence. As the former Director of Research at Google, he played a key role in shaping the technologies behind Google Search — the flagship product of one of the most transformative companies of our era.
He is also a personal hero. I had the opportunity to learn from his seminal book and the privilege of working at a company that became possible thanks to his work. In fact, his textbook Artificial Intelligence: A Modern Approach has trained generations of engineers and researchers, many of whom have gone on to lead companies in AI, robotics, and machine learning.
This week, we will develop a trading strategy using informational edge. Informational edge refers to having access to superior or less-known information that can be used to make better trading or investment decisions. It could be:
Faster access to public data (e.g., low-latency news feeds)
Deeper insights from alternative data (e.g., satellite imagery, credit card data, web traffic)
Proprietary analysis (e.g., unique sentiment models, NLP on earnings calls)
The key idea: you know something the market hasn’t fully priced in yet — and you act before others catch up. As Peter would also say, “Simple models and a lot of data trump more elaborate models based on less data.”

Here's the plan we’ll follow:
First, we’ll discuss the different types of edges and take a closer look at informational edge;
Then, we’ll introduce the dataset used to build the strategy;
Next, we’ll develop a simple model and demonstrate its strong predictive power—thanks to the unique data;
We’ll then formulate a trading strategy and present the results;
Finally, we’ll wrap up with key takeaways and next steps.
This is a production-level model, so some details will be omitted for obvious reasons.
As many of you have requested, I’ll be sharing some of my codebase in a course. It’s almost ready and should be finished in the coming weeks. I’ve created the page below to explain the course content, who it’s for, and to answer the main questions about it. If you have any additional questions, feel free to send me an email.
Now, to the strategy!
Different types of edge
An edge is any sustainable advantage that increases your probability of making profitable decisions compared to the rest of the market. Put simply:
An edge is what allows you to make money when others don’t.
Some key characteristics of a real edge:
Repeatable – Not just luck or a one-time insight
Testable – You can back it up with data or logic
Actionable – It translates into decisions you can trade on
Durable – It lasts long enough to extract value before it's arbitraged away
There are a few types of edges. I've heard people classify them into 3-5 different types. A possible classification is:
Informational Edge
Access to better or faster information.
Analytical Edge
Superior ability to analyze the same data everyone has — e.g., better models, smarter features, novel metrics.
Behavioral Edge
Ability to stay rational when others panic or overreact — exploiting predictable human biases.
Structural Edge
Benefits from the setup — like lower transaction costs, access to certain markets, or priority in order execution.
Technical Edge
Superior tech infrastructure — e.g., co-located servers, low-latency systems, or highly optimized software for faster execution than competitors.
To generate alpha, we must have some sort of advantage, or edge, over the competition. The two most common claims lie in having either better information (Information Edge) or better analysis (Analytical Edge).
Generating alpha via better information implies that the information collected is either better than what others have access to or altogether different from what others are looking for. To have an Information Edge, we must know something that others do not.
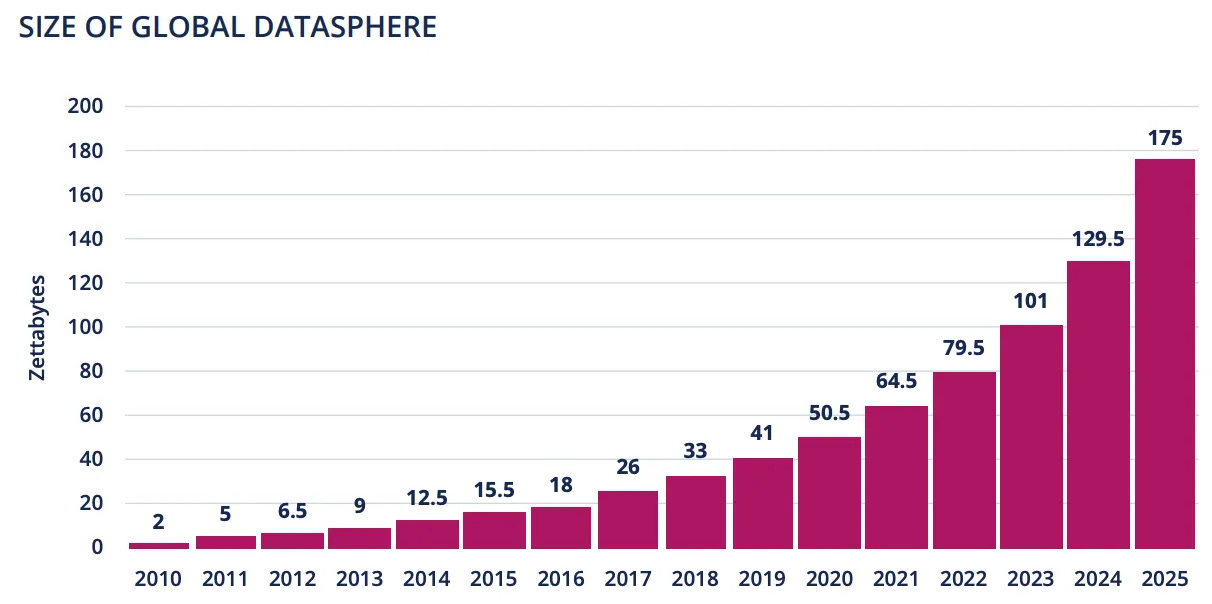
This is precisely what’s driving the rapid growth of the alternative data industry. As traditional data sources become widely accessible and quickly priced into the market, firms are turning to unconventional datasets—like satellite imagery, web traffic, credit card transactions, and social media sentiment—to uncover insights others overlook. The goal is to extract unique, actionable signals before they become mainstream, turning informational asymmetry into alpha.
Today, we’ll use a sample news sentiment dataset to explore how alpha can be extracted from information that isn’t widely accessible. This dataset is costly and typically reserved for hedge funds and institutional investors—firms for whom the potential return justifies the investment in exclusive data sources. Let's get to it.
The dataset
Many firms specialize in providing news sentiment data, leveraging AI—specifically Natural Language Processing (NLP)—to extract signals from vast volumes of unstructured text. These systems quantify the tone, relevance, and impact of news articles, headlines, and press releases, transforming qualitative content into structured data that can be used to inform trading decisions in real-time.
To transform news into data, these firms first acquire raw content from premium news providers like Dow Jones. They then apply NLP algorithms to parse and analyze the text, generating a rich set of features. The output is a structured dataset—delivered with only a few seconds or minutes of delay—containing columns such as:

Working with these datasets presents several challenges. Efficiently handling tens of millions of rows is one; another is the need for additional cleaning and preprocessing to ensure data quality.
The model
Let’s now use this data to model next-day returns. Our goal is to train a model that predicts the return over the next 24 hours, using all news published in the preceding 24 hours. Specifically, we’ll model close-to-close price returns.
To demonstrate the power of Informational Edge, we won’t use any additional features—only those derived from the news sentiment dataset.
The first challenge we face is feature engineering. Over a 24-hour period, a stock:
May have several news articles written about it
Or may have no news at all
So, how do we combine all the news related to a stock within a time window into a single sentiment score?
Odds Ratios and Log(Odds Ratios)
Answering this question is essential for engineering the core feature of our model. To answer it, we derive inspiration from log-odds ratios, which are commonly used in logistic regression and text classification to quantify relative likelihoods.
If you have never heard about it, I leave you with Josh Starmer's clear explanation (he has one of the coolest YouTube channels :)):
To transform raw sentiment probabilities into a more interpretable and aggregatable score, we use the following formula:
By applying the logarithm to the ratio of positive and negative sentiment probabilities, we emphasize the direction and strength of the sentiment signal. Multiplying by $(1 - P_{neutral})$ acts as a confidence weighting, downscaling the score when the model is uncertain or when the news is neutral in tone. This feature can then be averaged to produce a final sentiment score per stock per day.
More preprocessing
To achieve good results, additional preprocessing steps are necessary. Some of the most important adjustments include:
Standardizing returns within each GICS sector: Instead of predicting raw next-24-hour returns, we subtract the sector mean and divide by the sector standard deviation.
Filtering by relevance: We include only news articles that exceed a specified relevance threshold.
Encoding categorical topics: We convert categorical topic tags into one-hot encoded features.
Linear Regression
There are many modeling options available for predicting next-day returns, including tree-based models like XGBoost, neural networks, and other more complex machine learning architectures. However, for this initial exploration, we’ll start with linear regression—a simple yet powerful baseline.
Linear regression is particularly well-suited for our use case because:
It’s interpretable, allowing us to understand the relationship between sentiment features and returns.
It works well when the number of features is moderate and the signal-to-noise ratio is low.
It’s fast to train and easy to validate, making it ideal for rapid iteration.
It provides a strong benchmark to compare against more complex models later.
This simplicity will help us evaluate whether the informational edge in the sentiment data alone is enough to generate alpha.
As in previous articles, we follow a rolling training approach: at the start of each year, we look back over the past 10 years to train the model, then use it to make predictions for that specific year. This process is repeated annually.
The edge
After training the model, the first question we want to answer is: what is the edge of using such a model?
To analyze that, we:
Compute the prediction for every stock in the universe for every day since 2010;
Compute the realized future returns for every stock;
Assign a quintile to each stock every day (Q5: lowest signal; Q1: highest signal);
Aggregate by decile and annualize returns.
Here's what we found:

Ideally, we would expect returns to increase steadily from Q5 to Q1. If it weren't by Q2, we would have seen a perfectly monotonic relationship: the higher the signal, the higher the return (which is exactly what we wanted). The fact that Q2 > Q1 isn't fatal, but it weakens the ideal monotonic structure you'd want in a clean alpha factor.
Well, life is not perfect, especially in the realm of very simple models. Let's move forward in constructing long-short portfolios (long Q1, short Q5) and backtest that. The signal will be the ranking feature. Let's also note that non-linear ML models might actually capture these patterns better than OLS, but that will be addressed in a future article.
Experiments
Our first experiment is the simplest possible strategy:
At the end of every day, we will use the signal generated from the past 24-hour news articles to rank the stocks;
We will long the top quintile and short the bottom quintile;
We will hold the portfolio for 24-hours; at the end of the next trading day, we will repeat the process.
That's it. It can't get simpler than that. Also, in all backtests, I assumed IBKR's Pro Tier 3 trading costs. Let's see the results:


Not bad for a first experiment:
We see a good 1.88 Sharpe ratio vs. 0.73 the benchmark, over 2x better;
The annual return is at 18.7%, also much better than the S&P 500 in the same period;
The maximum drawdown is only 11% vs. 34% the benchmark;
But the really eye-popping stat is the 0.01 correlation with the benchmark.
This is a 100% market-neutral strategy, with 100% gross exposure and zero net exposure. But there’s a problem with this backtest—can you spot it?
Restricting Shorts to the S&P 1500 Index
We’ve demonstrated that news sentiment data can be effectively used to predict next-day returns. In an ideal world, this would translate into a smooth and profitable equity curve.
However, the world is not ideal. To replicate these results in live trading, we would need to short every stock the model signals—and that’s simply not feasible.
The best way to realistically backtest short positions would be to use historical short availability or inventory data. Unfortunately, Interactive Brokers does not provide historical short inventory, only daily snapshots going forward. So how can we proceed?
One practical solution is to restrict short positions to S&P 1500 constituents and assume those shorts can be filled. While not always true, this is a reasonable approximation for backtesting purposes—at least until we transition to forward testing.
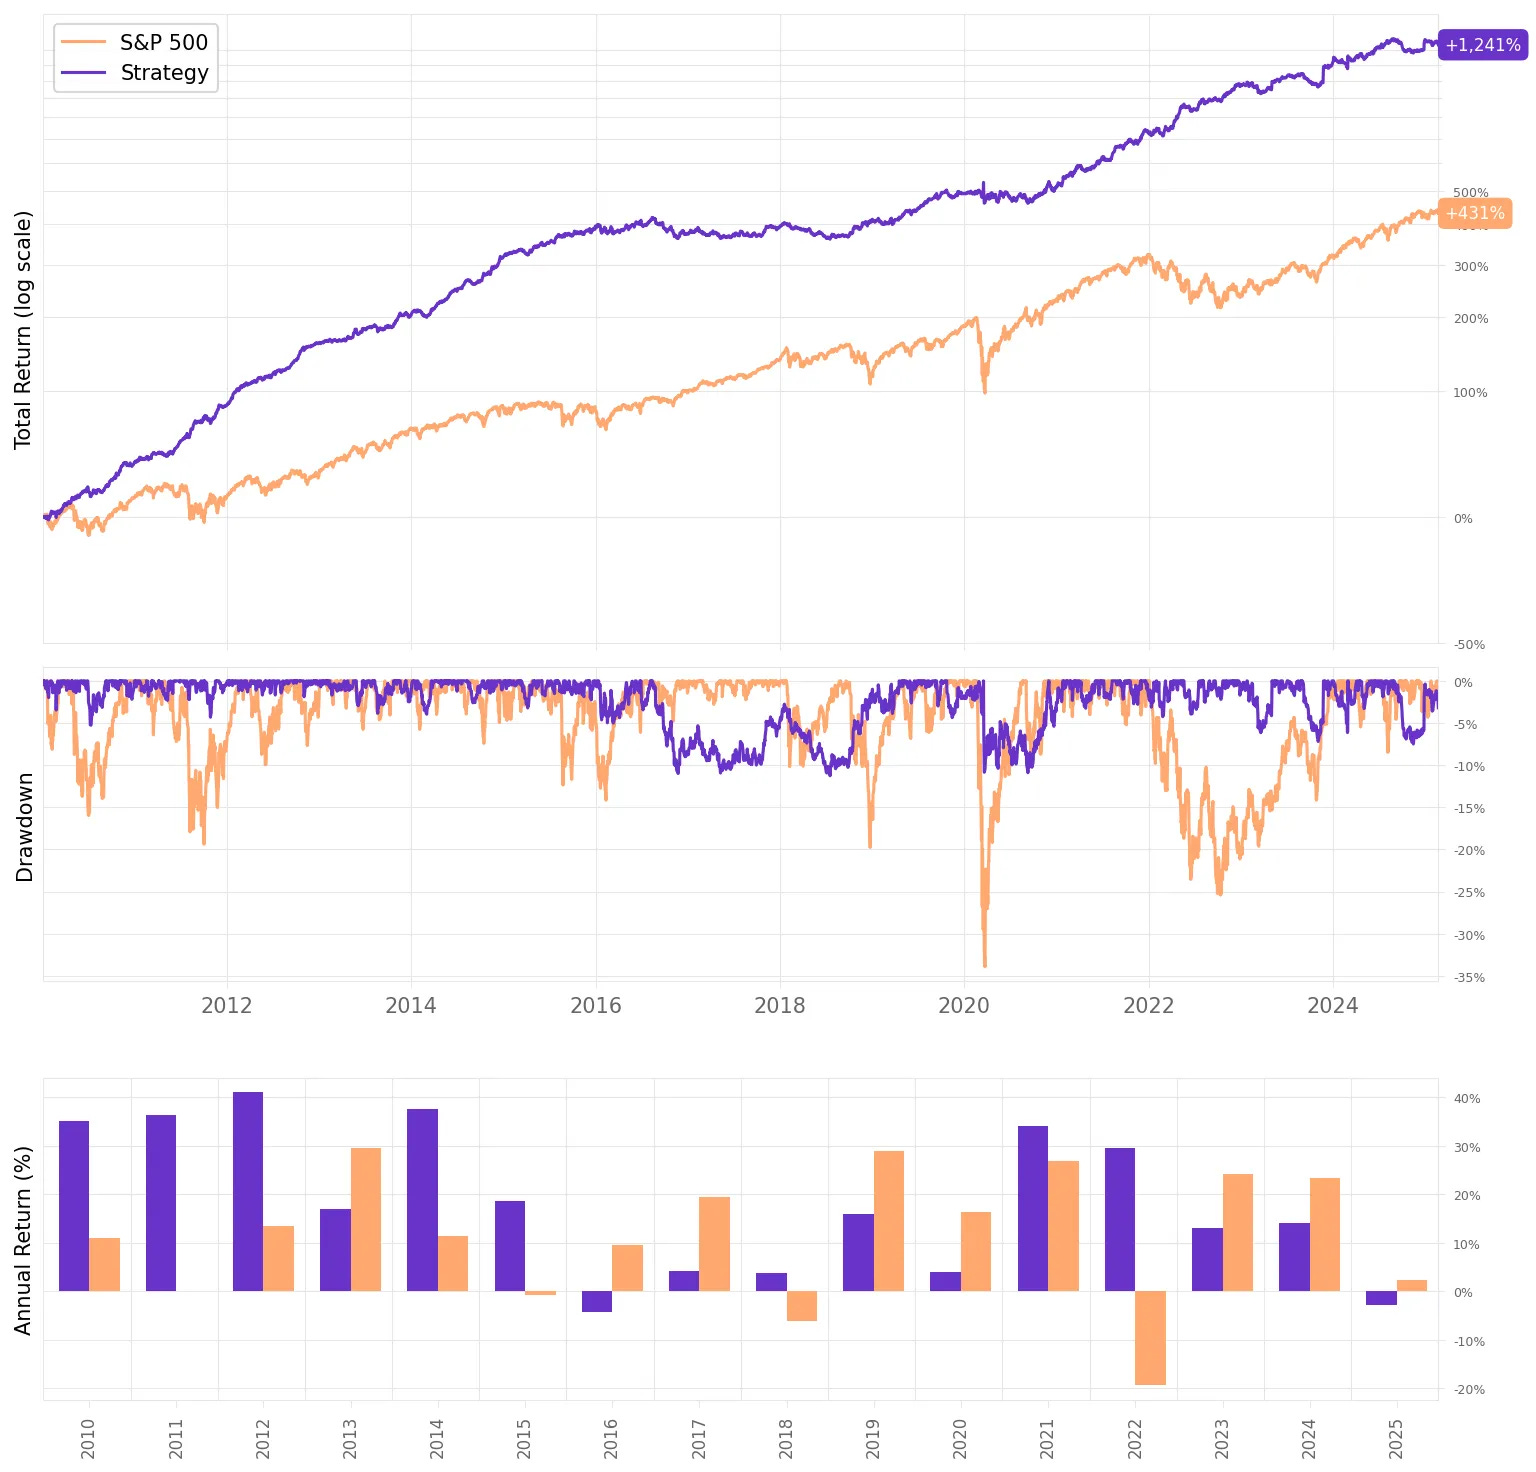
Let’s see how the strategy performs under this constraint.


That's a nice improvement:
The Sharpe ratio now is at 2.14 vs. 1.88 in the previous test;
The annual return is at 21.4%, about 2x the benchmark;
The maximum drawdown increases a bit, from 11% to 13%, but is still much lower than the 34% of the S&P 500;
The strategy continues uncorrelated to the market (-0.01);
All the trade stats improve vs. last experiment.
Is there anything else we can do to improve?
Changing the Net Exposure
So far, the strategy we've been testing has zero net exposure. But what if we change it to, say, +10% net exposure?
Having a positive net exposure can be beneficial when investing in stocks, as equities tend to rise over the long term, allowing you to capture the market’s natural upward drift.
Let's see the impact of this change:
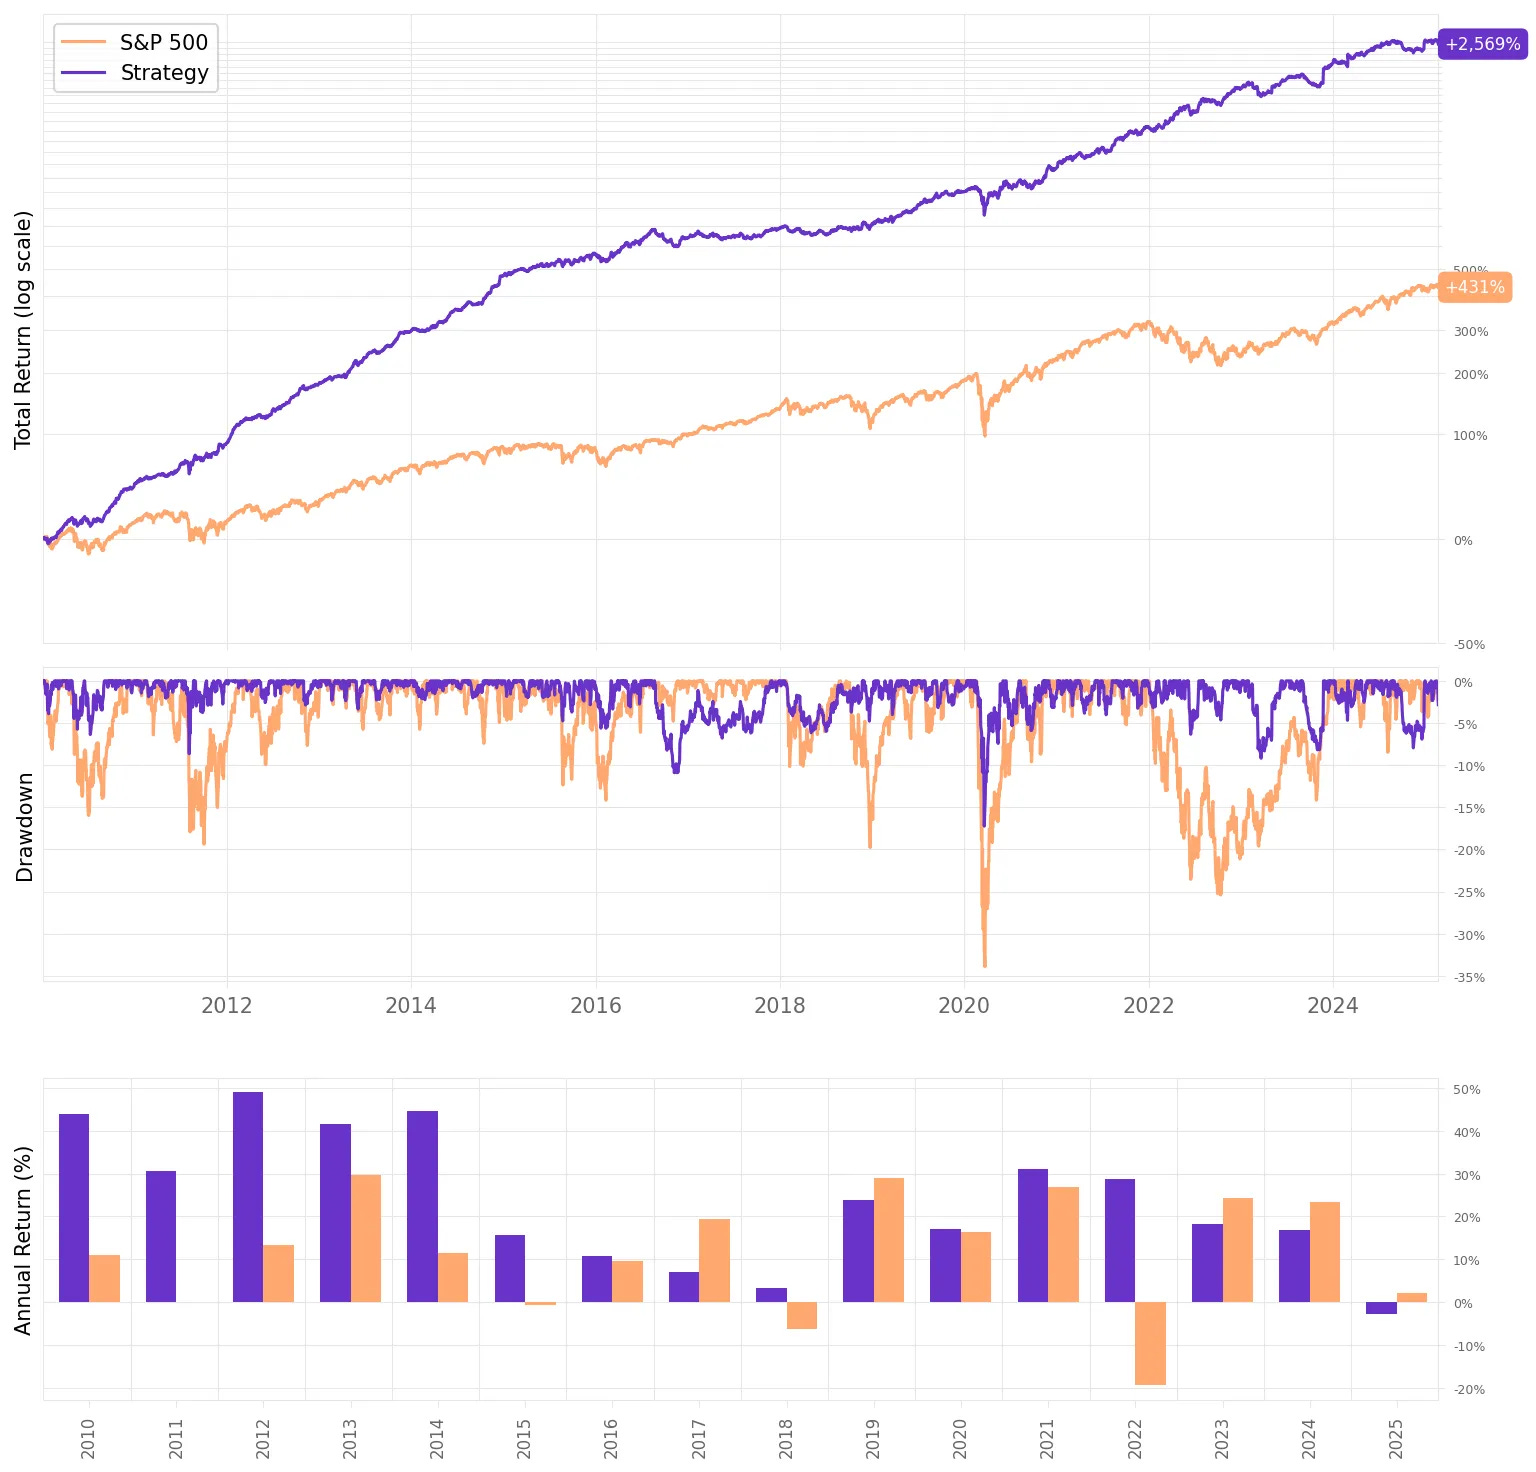

By taking more risk, we improve the overall returns as expected, at the expense of increasing the maximum drawdown.

If we had traded this strategy since 2010:
We would have had only one negative year (this year so far);
We would have seen 74% of the months positive, with the best at +14.1% (Nov'23);
We would have seen 26% of the months negative, with the worst at -9.0% (Mar'20);
The longest positive streak would have been 18 months, from Sep'13 to Feb'15;
The longest negative streak would have been 3 months, from Jan'18 to Mar'18.
How much of this performance is driven by common risk factors?
To better understand what’s driving the strategy’s returns, we apply the Fama-French 3-Factor Model to analyze its exposure to well-known risk factors: market, size, and value. By performing an OLS regression on the strategy’s excess returns using these factors, we can break down its performance into:
Market Risk (Mkt-RF): Measures how sensitive the strategy is to overall market movements, capturing broad market exposure.
Size (SMB): Evaluates whether the portfolio has a tilt toward smaller or larger stocks.
Value (HML): Determines whether the strategy favors value stocks or growth stocks.
For this analysis, we used daily factor data from Kenneth French’s website. Here are the results:
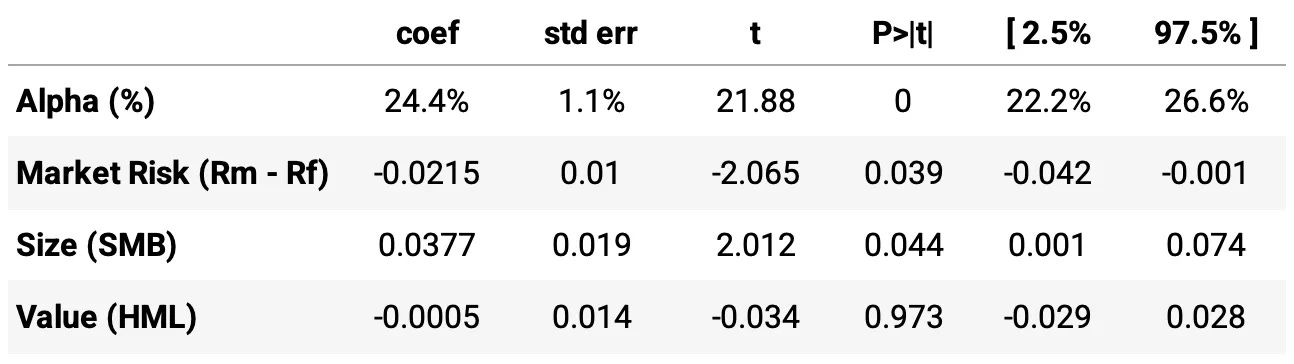
Highlights:
Annualized alpha of 24.4%, statistically significant (t = 21.88, p < 0.001), indicating strong performance unexplained by common risk factors.
Negative and statistically significant exposure to market risk (Mkt-RF), suggesting the strategy is slightly defensive or market-neutral.
Positive exposure to the size factor (SMB), indicating a tilt toward smaller-cap stocks, with statistical significance (p = 0.044).
No significant exposure to the value factor (HML), with a near-zero coefficient and an insignificant p-value (p = 0.973).
Final thoughts
This article explored how informational edge, driven by alternative data, can be harnessed to build a high-performing, market-neutral trading strategy. Using only features derived from a premium news sentiment dataset, we demonstrated that even a simple linear model—when paired with rich, well-engineered inputs—can deliver strong, persistent alpha.
We showed that news sentiment is not just noise: it carries predictive power. Even after accounting for execution costs, the strategy posted high Sharpe ratios, low drawdowns, and near-zero correlation to the broader market—an attractive profile for hedge funds or institutional allocators seeking diversification.
That said, we’ve only scratched the surface. This was a baseline model designed to showcase the power of unique data. There are many exciting directions for improvement:
Replace linear regression with non-linear models (e.g., gradient boosting or deep learning) to capture richer sentiment-return relationships.
Explore longer or shorter holding periods, potentially adjusting for momentum decay or reaction lag.
Combine this sentiment signal with other orthogonal factors (e.g., earnings quality, technicals) for improved robustness.
Alternative data offers a real edge—but only if paired with thoughtful modeling, careful preprocessing, and disciplined execution. If this is what a simple model can achieve, imagine what’s possible with deeper pipelines, more compute, and continuous learning.
As always, I’d love to hear your thoughts. Feel free to reach out via Twitter or email if you have questions, ideas, or feedback.
Cheers!
one of your best articles yet!
Did you by any chance run the same experiment for going Long only? There can be - as you mention - issues with short selling both operationally and emotionally - therefore wondering what the result would be if you only went long the top quartile in your model?
Very cool article. Average pnl seems kind of low though. Did you factor in slippage?